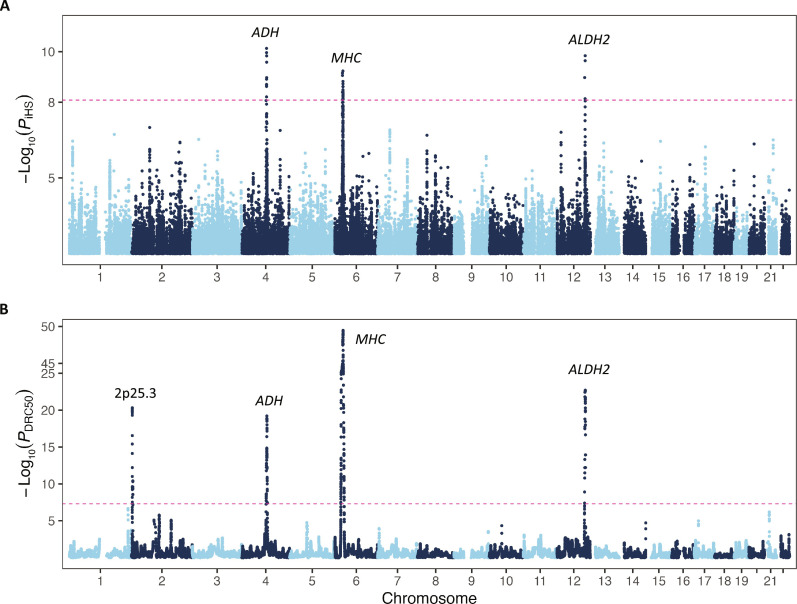
Fig. 4. Positive selection signals in the Japanese population based on iHS and FastSMC analysis.
(A) Manhattan plot showing the genome-wide distribution of PiHS for variants in autosomes in the iHS analysis. The red horizontal dashed line indicates the genome-wide significance threshold of PiHS = 8.24 × 10⁻⁹. (B) Manhattan plot of the FastSMC analysis; the genome-wide significance threshold is set at PDRC50 = 5 × 10⁻⁸.

