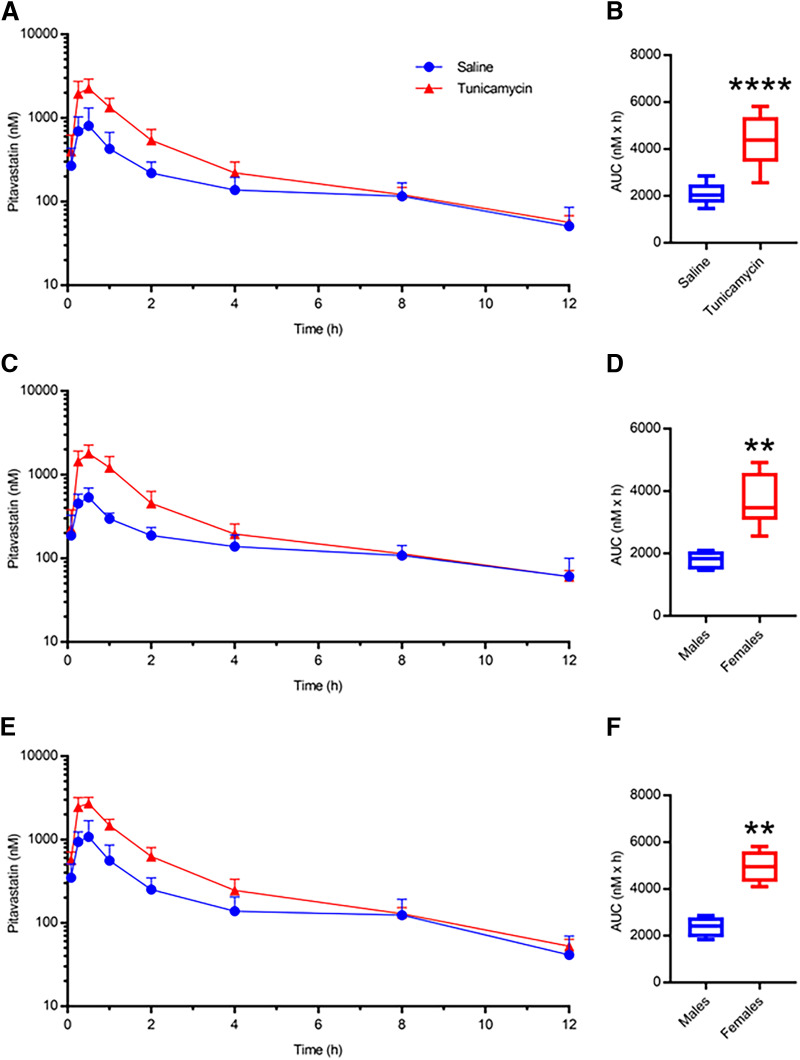
Fig. 9.
PIT plasma concentration-time profiles for mice administered saline or tunicamycin in both sexes (A, n = 12) and corresponding PIT AUC data (B). PIT plasma concentration-time profiles and corresponding PIT AUCs for male (C and D, n = 6) and female (E and F, n = 6) mice. For box and whisker plots, the box extends to the 25th and 75th percentiles with the median represented as the horizontal line, and the whiskers represent the 90% confidence interval. Unpaired Mann–Whitney t test: ** P ≤ 0.01 or **** P ≤ 0.0001.

