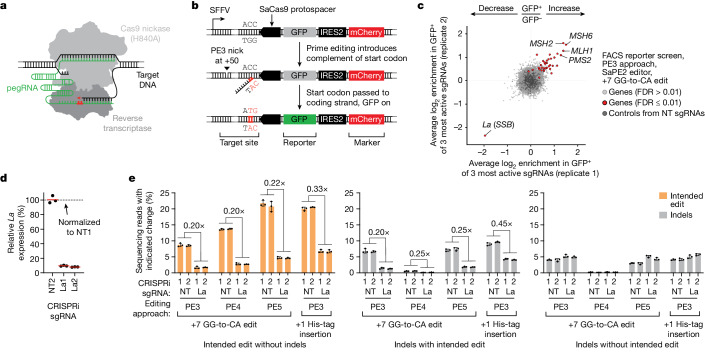
Fig. 1. Genome-scale CRISPRi screens identify La as a key determinant of prime editing.
a, Schematic of prime editing. b, Schematic of the FACS reporter of prime editing. c, Gene-level phenotypes from genome-scale CRISPRi screen performed in FACS reporter cells with the SaPE2 editor, +7 GG-to-CA edit and the PE3 approach. Phenotypes represent enrichment of normalized sgRNA counts in GFP+ over GFP– populations after prime editing (average for the top three sgRNAs per gene). Hit genes (FDR ≤ 0.01) were identified using CRISPhieRmix16. Pseudogene controls generated from randomly selected non-targeting (NT) sgRNAs. d, Quantification of CRISPRi-mediated La depletion. Reverse transcription followed by quantitative PCR (RT–qPCR) of RNA from K562 CRISPRi cells with integrated MCS reporter. Data are normalized to ACTB and are presented relative to a non-targeting sgRNA (NT1). La1 and La2, La-targeting sgRNAs. e, Percentages of prime editing outcomes produced at the integrated MCS reporter using the SaPE2 editor with or without depletion of La in K562 CRISPRi cells. Percentages of intended prime editing without indels (left), indels with the intended prime edit (middle) and indels without the intended edit (right) plotted separately. Editing components delivered by plasmid transfection in c and e. Horizontal bars in d indicate geometric means (n = 3 independent biological replicates). Data and error bars in e indicate mean ± s.d. (n = 3 independent biological replicates). Image of the prime editor protein in a adapted from ref. 5, Elsevier, under a Creative Commons licence CC BY 4.0. Images of DNA and pegRNA in a adapted from ref. 40, Elsevier.

