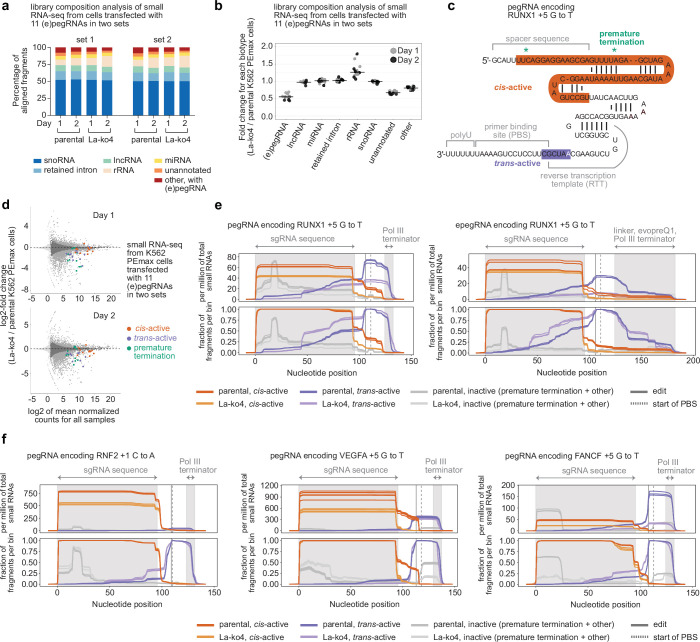
Extended Data Fig. 6. Details of small RNA-seq experiment performed with two sets of (e)pegRNAs.
a, Composition of small RNA-seq libraries from K562 PEmax parental or La-ko4 cells. Data are from samples collected one and two days after transfection of eleven (e)pegRNAs in two sets. b, Fold changes in normalized counts of indicated biotypes in La-ko4 cells relative to parental K562 PEmax cells, from samples collected one and two days after transfection of eleven (e)pegRNAs in two sets. Counts were calculated per replicate for each set of (e)pegRNAs as the sums of properly aligned fragments classified as each biotype and normalized by total RNA counts. c, Schematic of minimum sequence defining each class of (e)pegRNA fragments from small RNA-seq (orange, cis-active; purple, trans-active). Representative sequence used (i.e., RUNX1 + 5 G to T pegRNA). Edit-encoding nucleotide (white base) and cryptic terminators (green asterisks) indicated. d, Plot (MA) of small RNA-seq data displaying mean normalized expression versus log2-fold change in expression of human genes and (e)pegRNA bins from La-ko4 cells relative to parental K562 PEmax cells. Data are from samples collected one (top) and two (bottom) days after transfection of plasmids encoding seven pegRNAs and four epegRNAs. Alignment categories are indicated (gray, human small RNA; orange, cis-active; purple, trans-active; green, premature termination) and genes with adjusted p-values ≤ 0.05 are highlighted in light gray. e, Coverage plots of small RNA-seq fragments for the pegRNA (left) or epegRNA (right) specifying RUNX1 + 5 G to T from specified cell lines collected one day after (e)pegRNA plasmid transfection. Data are normalized by counts of fragments from total human small RNA (top) or those within the corresponding bins: cis-active, trans-active, inactive (bottom). Nucleotide position 0 denotes the 5′ end of the RNA, and positions of the edit-encoding nucleotide (vertical solid line) and the start of PBS (vertical dashed line) are indicated. Shaded areas represent sgRNA sequence and Pol III terminator (pegRNA) or sgRNA sequence, linker, evopreQ1, and Pol III terminator (epegRNA). f, Coverage plots of small RNA-seq fragments for pegRNAs specifying RNF2 + 1 C to A (left), VEGFA + 5 G to T (middle) or FANCF + 5 G to T (right) from specified cell lines collected one day after (e)pegRNA plasmid transfection. Data are normalized by counts of fragments from total human small RNA (top) or those within the corresponding bins: cis-active, trans-active, inactive (bottom). Nucleotide position 0 denotes the 5′ end of the RNA, and positions of the edit-encoding nucleotide (vertical solid line) and the start of PBS (vertical dashed line) are indicated. Shaded areas represent sgRNA sequence and Pol III terminator. Data in a indicate means (n = 3 independent biological replicates). Horizontal bars in b indicate medians (12 data points per biotype, each biotype has n = 3 independent biological replicates for each day and each set of (e)pegRNAs). Data in d were calculated from n = 6 (VEGFA + 5 G to T) and 3 (all others) independent biological replicates and adjusted P-values were calculated by DESeq233 using the two-tailed Wald test with Bonferroni-Holm correction. Coverages in e and f represent n = 6 (VEGFA + 5 G to T) and 3 (all others) independent biological replicates. Image of pegRNA in c adapted from ref. 64, Springer Nature America.

