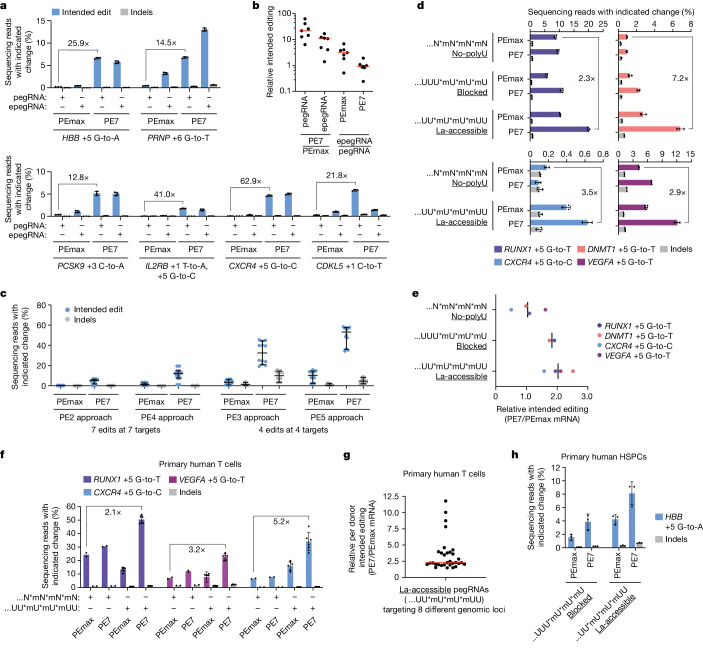
Fig. 5. PE7 enhances prime editing at disease-related targets and in primary human cells.
a, Percentages of prime editing outcomes at six endogenous loci in U2OS cells using pegRNAs and epegRNAs (tevopreQ1). Data from pegRNAs also plotted in c. b, Fold changes in intended prime editing for the six edits in a (editing percentages in a) and one additional edit for which editing percentages were lower (HBG1 and HBG2). c, Prime editing outcome frequencies from indicated approaches (pegRNAs only) in U2OS cells. Data from six endogenous loci in a and HBG1 and HBG2 (PE2 and PE4) or a subset (PE3 and PE5). d, Percentages of prime editing outcomes at four genomic loci in K562 cells using PEmax or PE7 mRNA and synthetic pegRNAs with indicated 3′ end configurations. e, Fold changes in average intended prime editing in K562 cells using PE7 mRNA relative to PEmax mRNA for synthetic pegRNAs with indicated 3′ end configurations. Editing percentages in d. f, Percentages of prime editing outcomes in primary human T cells using PEmax or PE7 mRNA and synthetic pegRNAs with indicated 3′ end configurations. g, Fold changes in intended prime editing in primary human T cells using PE7 mRNA relative to PEmax mRNA with La-accessible pegRNAs at eight genomic loci. h, Same as f but at the HBB locus in primary human HSPCs. The PE2 approach was used in a,b, and d–h. Underlining in d,e,g,h indicates particular 3′ end configuration patterns. Editing components were delivered by plasmid (a–c) or RNA (d–h) transfection. Data and error bars in a,d,f,h indicate the mean ± s.d. (n = 2–3 independent biological replicates for a and d; n = 6 or 2 donors for f; n = 3 donors for h). Horizontal or vertical bars in b and e indicate medians (7 and 2/4 edits, respectively) of ratios of means (n = 3 independent biological replicates for each edit) and in c indicate medians with 99% confidence interval (7 edits for PE2 and PE4, 4 edits for PE3 and PE5, each with n = 3 independent biological replicates plotted individually). Data and horizontal bar in g indicate ratios of intended editing and median (8 edits, n = 4 donors plotted individually).

