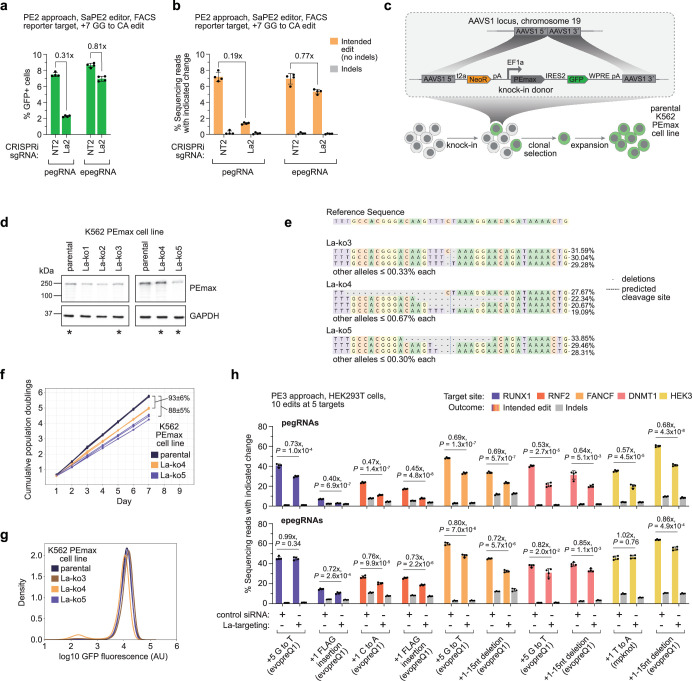
Extended Data Fig. 3. Validating La phenotypes with various genetic perturbation modalities.
a, b, Percentages of prime editing outcomes produced at integrated FACS reporter with pegRNA (left) or epegRNA (right, tevopreQ1) in K562 CRISPRi cells after transduction of the indicated sgRNA. Intended editing quantified by flow cytometry (a) or sequencing (b). c, Schematic of workflow used to engineer K562 clonal cell lines with PEmax expressed constitutively from the AAVS1 safe-harbor locus (parental K562 PEmax cells). d, Western blot analysis of K562 cells constitutively expressing PEmax (K562 PEmax parental) and clones with genetic disruption of La (La-ko1-La-ko5). Asterisks, cell lines used in this study. Images are from the same blot as presented in Fig. 2a. For additional details on imaging, see Methods and Supplementary Fig. 8. e, Sequences and frequencies of alleles observed at the La locus in the La-knockout clones used in this study (La-ko3 through La-ko5). Analysis performed with CRISPResso247. f, Cumulative population doublings of parental, La-ko4, and La-ko5 K562 PEmax cells. g, Flow cytometry analysis of GFP expressed from the PEmax construct at the AAVS1 locus in K562 PEmax parental, La-ko3, La-ko4, and La-ko5 cells. Data collected from cells prior to transfection for experiment depicted in Fig. 2c. h, Percentages of prime editing (PE3) outcomes across ten edits with pegRNAs (top) or epegRNAs (bottom) at five genomic loci in HEK293T cells with and without depletion of La by siRNA. Fold-changes in outcome frequencies presented in Fig. 2e. Editing components delivered by plasmid transfection in a, b and h. Data and error bars in a, b and h indicate mean ± s.d. (n = 4 independent biological replicates). Data in d, e and g depict results from characterizations of n = 1 cell lines. Percentages in f indicate relative mean ± s.d. (n = 3 independent biological replicates measured across an 8-day time course) of daily fold changes in cell numbers, essentially the relative percentages of cells to expect after one day of growth for La-ko4 and La-ko5 compared with parental K562 PEmax cells. P-values in h are from one-tailed unpaired Student’s t-test.

