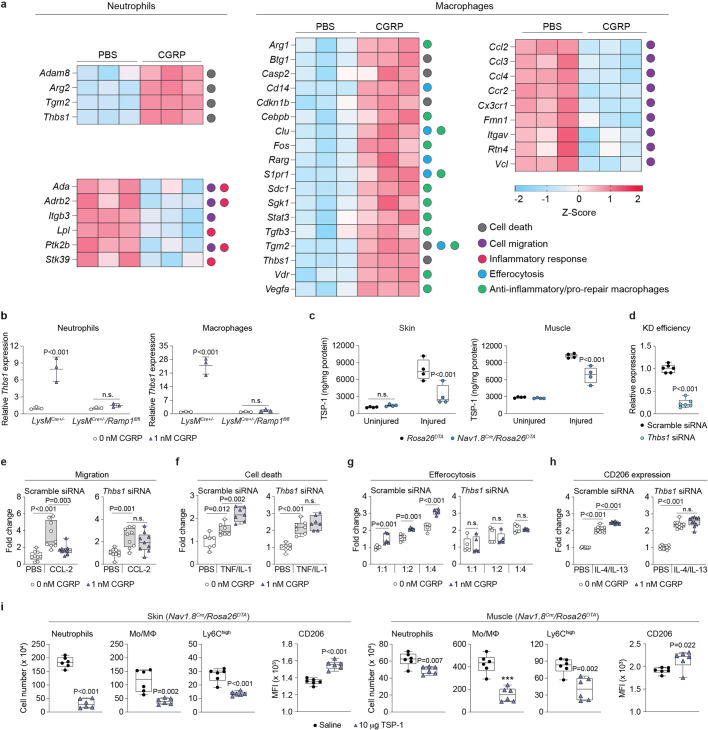
Extended Data Fig. 6. TSP-1 mediates the activity of CGRP on neutrophils and macrophages.
a, Differentially expressed genes contributing to GO enrichment analysis of CGRP-treated neutrophils and macrophages. Neutrophils and monocytes/macrophages were treated with CGRP (1 nM) or saline for 4 h. Transcriptomic profiling was performed by bulk RNA sequencing. Heatmap of selected significantly upregulated and downregulated genes depicting standardised gene expression values (z-scores) in CGRP-treated cells compared to PBS-treated cells. Individual biological replicates are shown (n = 3). Genes are displayed in alphabetical order and further classified according to known functions indicated by the coloured circles next to the heat map. b, Thbs1 expression after CGRP (1 nM) stimulation for 4 h in neutrophils and macrophages isolated form LysMCre+/– and LysMCre+/–/Ramp1fl/fl mice (n = 3). Dots represent independent experiments. Horizontal bars show mean. Whiskers show min. to max. range. c, TSP-1 concentration in skin and muscle before (uninjured) and at D3 post-injury quantified by ELISA (n = 4). d, Knockdown (KD) efficiency of TSP-1 by siRNA verified by qPCR analysis in macrophages. Results are expressed as relative expression over cells transfected with scramble siRNA (n = 6). e–h, Macrophages derived from mouse bone marrow were transfected with scramble siRNA or Thbs1 siRNA and treated with saline (PBS, 0 nM CGRP) or CGRP (1 nM). Results are expressed as fold change over the PBS/0 nM CGRP control group. Transwell migration towards CCL2 in the presence of CGRP (e) (n = 9). Cell death in response to CGRP with or without TNF/IL-1 (f) (n = 7). Macrophage efferocytosis of neutrophils after CGRP treatment (g) (n = 5). Macrophage M2-like polarisztion determined via CD206 expression in response to CGRP and IL-4/IL-13 (h) (n = 10). i, Saline or TSP-1 (total 10 μg) was injected in mouse skin wound borders at D1 and D3 post-injury or delivered in mouse quadriceps volumetric muscle loss defect via a fibrin hydrogel right after injury. Neutrophil and monocyte/macrophage (Mo/Mϕ) populations in injured tissues were analysed by flow cytometry at D3 post-delivery. CD206 level measurements were performed at D14 post-delivery (n = 6). MFI is the geometric-mean of fluorescence intensity. All data are plotted in box plots showing median (central line) and IQR (bounds). Whiskers show min. to max. range. Dots represent independent experiments. Two-tailed Student’s t-test in b,c,d,i. One-way ANOVA with Tukey post hoc test for pair-wise comparisons in e–h. P values are indicated; n.s., non-significant.

