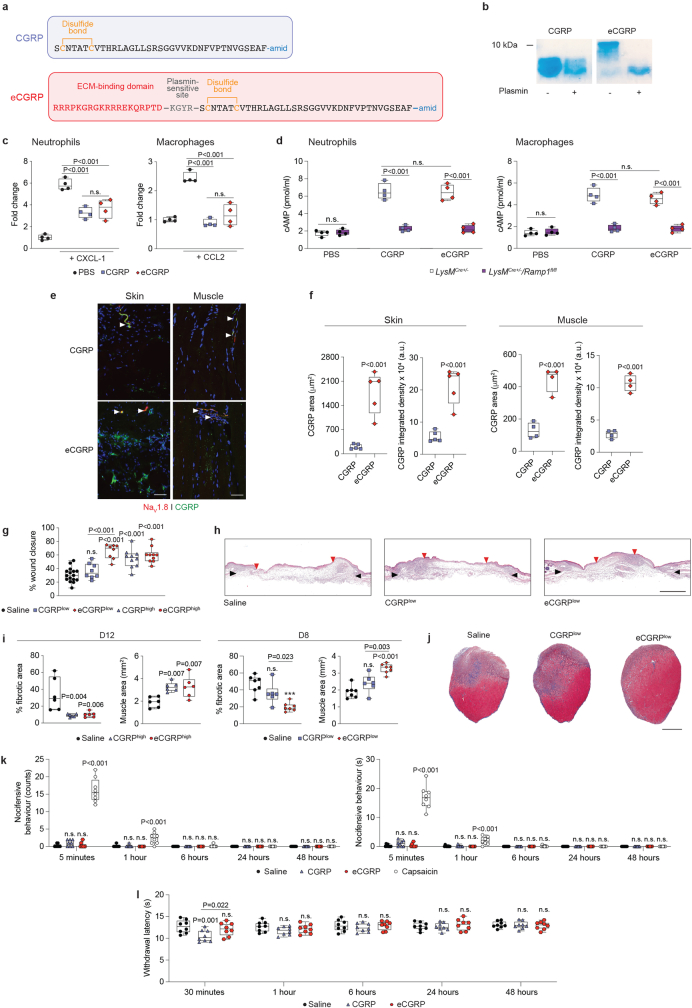
Extended Data Fig. 7. Rescue of tissue healing in Nav1.8Cre/Rosa26DTA mice by local delivery of CGRP variants.
a, Design and amino acid sequences of wild-type CGRP and eCGRP. Disulfide bonds are indicated in yellow. Amid indicates amidation of the C-terminus phenylalanine. ECM-binding sequence from placenta growth factor (PlGF) is in red. Plasmin-sensitive site from vitronectin is in grey. b, CGRP and eCGRP were incubated with or without plasmin and analysed by SDS-PAGE. The gels show cleavage of the ECM-binding sequence in eCGRP by plasmin. Repeated independently 3 times. For gel source data, see Supplementary Figure 1. c, eCGRP activity was assessed using neutrophil and macrophage migration. The graphs show migration towards a chemoattractant (CXCL-1 or CCL2) in the presence of saline (PBS) or CGRP variants (20 nM). Results are expressed as fold change over saline control. Data are plotted in box plots showing median (central line) and IQR (bounds). Whiskers show min. to max. range. Dots represent individual experiments (n = 4). d, Neutrophils and macrophages were isolated from LysMCre+/– and LysMCre+/–/Ramp1fl/fl mice. Cells were stimulated with CGRP or eCGRP (1 nM) for 30 min. cAMP concentration in cell lysates was measured by competitive ELISA (n = 4). e,f, CGRP (1 μg) or equimolar eCGRP was delivered intradermally or intramuscularly in Nav1.8Cre/Rosa26tdT mice. One day post-delivery, tissues were harvested and CGRP variants were detected by immunostaining. Representative skin and muscle tissue sections. CGRP signal coming from exogenous CGRP variants appears in green. Arrows indicate CGRP signal coming from NaV1.8+ sensory neurons (in red). Nuclei are in blue. Scale bars = 50 μm. Quantification of CGRP-positive area and signal intensity expressed as integrated density (f) (n = 5 for skin, n = 4 for muscle). g,h, Saline, low dose of CGRP (250 ng), high dose of CGRP (500 ng), or equimolar eCGRP was delivered on Nav1.8Cre/Rosa26DTA mouse skin wounds (D1 post-injury for low dose and D1 and D3 post-injury for high dose). Skin wound closure D6 post-injury evaluated by histomorphometric analysis (g) (n = 16 for saline; n = 8 for low; n = 10 for high). Representative skin histology (h). Black arrows indicate wound edges and red arrows indicate tips of epithelium tongue. Scale bar = 1 mm. i,j, Saline, low dose of CGRP (250 ng), high dose of CGRP (1 μg), or equimolar eCGRP was delivered in Nav1.8Cre/Rosa26DTA mouse quadriceps volumetric muscle loss defect via a fibrin hydrogel. The extent of muscle regeneration (represented by the percentage of fibrotic tissue and muscle area) was evaluated by histomorphometric analysis of tissue sections at D8 (low dose) and D12 (high dose) post-injury (i) (D12: n = 6; D8: n = 7 for saline and high, n = 6 for low). Representative histology (fibrotic tissue is stained dark blue; muscle tissue is stained red) (j). Scale bar = 1 mm. k, Mice received one injection of saline, CGRP (1 μg), equimolar eCGRP, or capsaicin (positive control) in the right hind paw. Graphs show duration and frequency of nocifensive behaviours recorded for 5 min at various time points (n = 8). l, Mice received one injection of saline, CGRP (1 μg), or equimolar eCGRP in the right hind paw. Graph shows thermal withdrawal latency at various time points post-injection (n = 8). All data are plotted in box plots showing median (central line) and IQR (bounds). Whiskers show min. to max. range. Dots represent independent experiments or injuries. One-way ANOVA with Tukey post hoc test for pair-wise comparisons in c,d,g,i. Two-tailed Student’s t-test in f. Two-way ANOVA with Bonferroni post hoc test for pair-wise comparisons in k,l. P values are indicated; n.s., non-significant.

