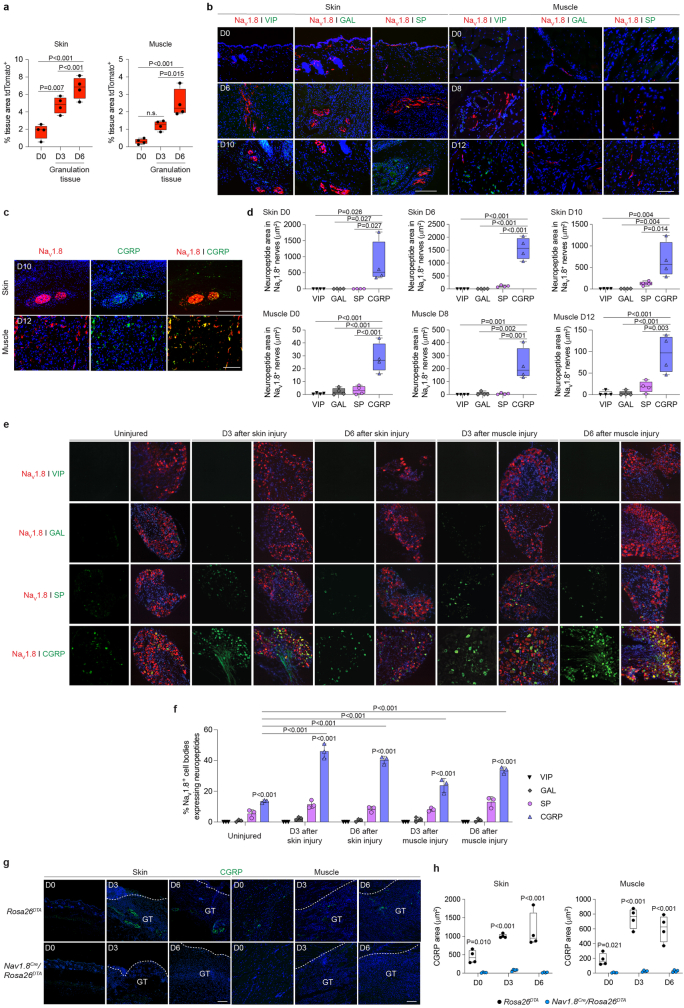
Extended Data Fig. 2. NaV1.8+ sensory neurons mainly express CGRP during skin and muscle healing.
a, Quantification of NaV1.8+ sensory neurons in skin and muscle before and after injury. Results are expressed as the percentage of tissue area positive for tdTomato in healthy tissue at D0 (uninjured) and in the granulation tissue at D3 and D6 post-injury (n = 4). b–d, Expression of neuropeptides in skin and muscle were detected by immunohistochemistry (neuropeptides, green; NaV1.8, red; nuclei, blue). Scale bars = 500 μm in skin and 100 μm in muscle. Quantification of neuropeptide signal in NaV1.8+ sensory neurons (d) (n = 4). e, Neuropeptide expression in DRGs before and on D3 and D6 after skin and muscle injury (neuropeptides, green; NaV1.8, red; nuclei, blue). Scale bar = 100 μm. Percentage of NaV1.8+ cell bodies expressing a neuropeptide type (f) (n = 3). g, CGRP localisation in skin and muscle before and after tissue injury in Nav1.8Cre/Rosa26DTA and Rosa26DTA littermate control mice. White lines indicate the separation between the granulation tissue (GT) and the top of the wound in skin and the separation between the granulation tissue and the muscle tissue in muscle. Scale bars = 100 μm. Quantification of CGRP signal (h) (n = 4). In a,d,h, data are plotted in box plots showing median (centre line) and IQR (bounds). Whiskers show min. to max. range. Dots represent independent injuries. In f, data are plotted as bar graph showing mean ± SD. Dots represent individual DRGs. One-way ANOVA with Tukey post hoc test for pair-wise comparisons in a,d. Two-way ANOVA with Bonferroni post hoc test for pair-wise comparisons in f,h. P values are indicated.

