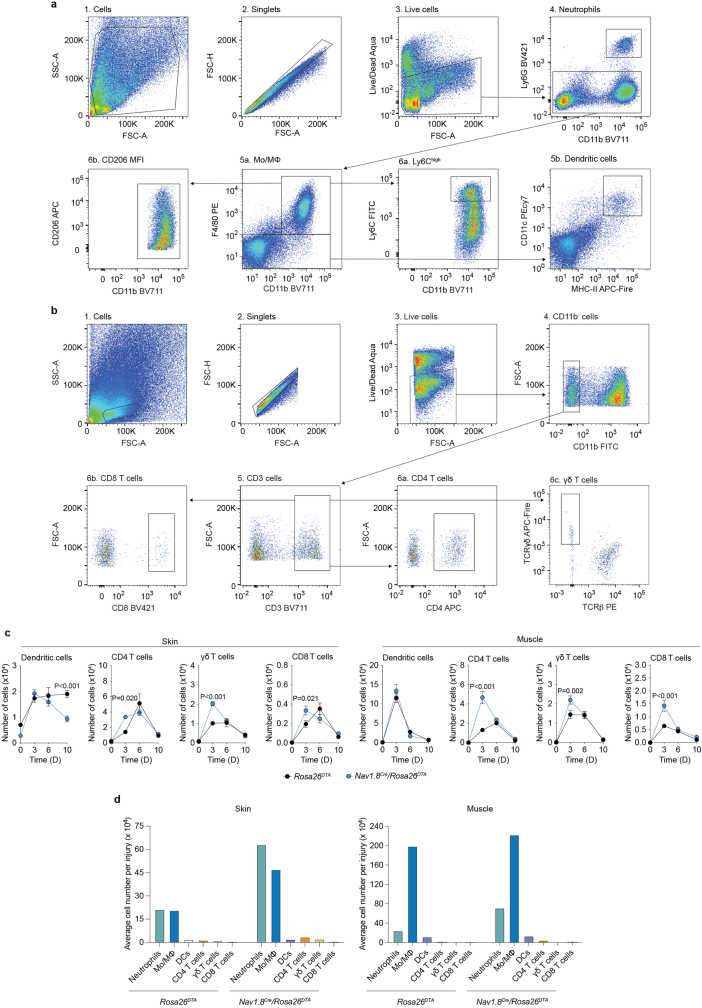
Extended Data Fig. 4. Analyse wound immune cell dynamics in injured skin and muscle.
a, Gating strategy to analyse myeloid cells in skin and muscle post-injury. Flow cytometry dot plots representing the step by step (1–6) gating strategy to identify neutrophil (CD11b+, Ly6G+, F4/80–) monocytes/macrophages (Mo/Mϕ; CD11b+, F4/80+, Ly6G–), and dendritic cells (CD11c+, MHC-II+). MFI is the geometric-mean of fluorescence intensity. b, Gating strategy to analyse T cells in skin and muscle post-injury. Flow cytometry dot plots representing the step by step (1–6) gating strategy to identify CD4 T cells (CD3+, CD4+), cytotoxic T cells (CD3+, CD8+), and γδ T cells (CD3+, TCRβ–, TCRγδ+). c, Numbers of dendritic and T cells in skin and muscle injuries analysis measured by flow cytometry. Data are plotted in kinetic line plots showing mean ± SEM (Skin: n = 8 for D0, n = 10 for the other time points. Muscle: n = 8). Two-way ANOVA with Bonferroni post hoc test for pair-wise comparisons. P values are indicated; n.s., non-significant. d, Bar graph representation of the average number of neutrophils, Mo/Mϕ, dendritic cells, and T cells in injured tissue at D3 post-injury in Rosa26DTA and Nav1.8Cre/Rosa26DTA mice.

