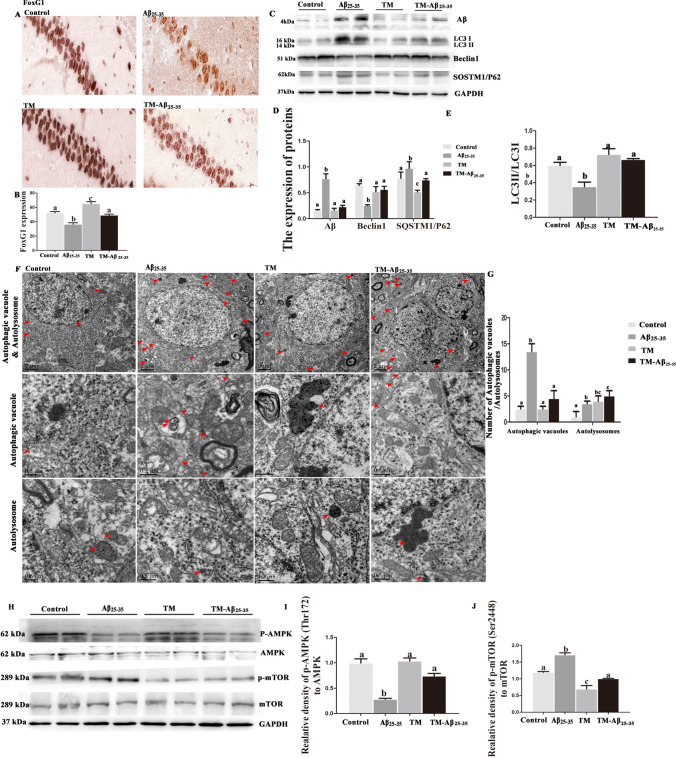
Fig. 6.
Tamoxifen forced FoxG1 overexpressed in the hippocampus of Aβ25-35-induced Cre/FoxG1fl/fl mice and FoxG1 activated autophagy via AMPK/mTOR pathway. The expressions of FoxG1 in the hippocampal sections was detected by the immunohistochemistry method in four groups. The representative images were captured by a microscope. Scale bar = 20 μm. (B [F3,20 = 29.40, P = 0.0001]). Bar chart indicates the qualification of FoxG1 expression. C The expressions of Aβ in the hippocampal tissues was detected by the western blot after Aβ25-35 microinjection, and then detected the proteins of LC3, Beclin1 and SQSTM1/P62. (D: Aβ [F3,20 = 29.11, P = 0.0001], Beclin1 [F3,20 = 7.912, P = 0.0089], SQSTM1/P62 [F3,20 = 4.126, P = 0.0484]). Bar chart indicates the relative expression of these proteins in (C). (E [F3,20 = 12.07, P = 0.0179]) Bar chart indicates the expression of LC3 II/LC3 I in (C). F TEM analysis for evaluating autophagy in four groups. Scale bar = 0.5 μm. (G autophagic vacuoles [F3,9 = 22.07, P = 0.0060], autolysosomes[F3,9 = 3.564, P = 0.1256]) Quantification of the autophagic vacuoles and the autolysosomes in (F). H The expression of AMPK, p-AMPK, mTOR, and p-mTOR proteins were studied by western blot in four groups. (I [F3,20 = 36.91, P = 0.0023], J [F3,20 = 48.38, P = 0.0013]). Bar chart indicates the expression of p-AMPK/AMPK or p-mTOR/mTOR in (H). GAPDH was used as loading control. For all experiments, different letters indicate statistical differences in mean values across groups (P < 0.05). Values are expressed as means ± SEM. *P < 0.05, **P < 0.01, ***P < 0.001. For each group, n = 6/group

