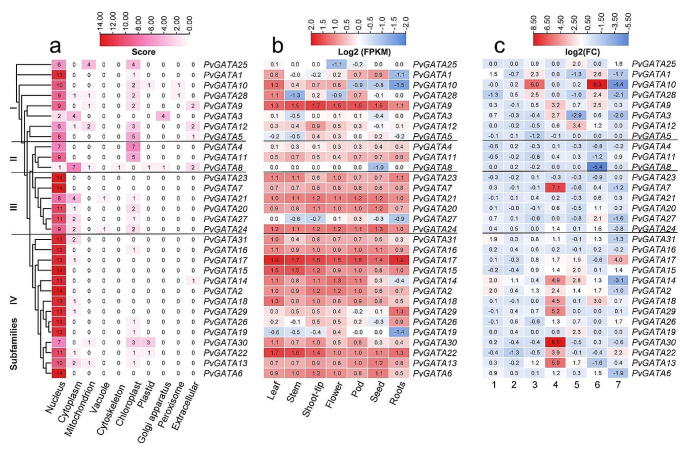
Fig. 6.
Heatmaps were generated to examine the expression patterns of PvGATA TFs under various cellular compartments, developmental stages, and stress conditions. The heatmaps were constructed and visualized using TBTools software. Black lines are used to differentiate between the subfamilies. (a) the sub-cellular localization of PvGATA proteins was predicted using the WoLF PSORT web tool. (b) The tissue-specific expression profiles of PvGATA at different developmental stages of the common bean plant were analyzed using publicly available transcriptome data (PRJNA210619) and displayed in a heatmap. The normalized fragments per kilobase of transcript per million fragments (FPKM) values were transformed by Log2(FPKM). (c) Expression analysis of PvGATA transcripts on different biotic and abiotic stress conditions using RNA-seq data publicly available. 1 and 2 samples were collected from the leaves and roots of a salt-tolerant vs. salt-sensitive cultivar under salt-stress conditions. (PRJNA656794). 3, Samples from lower hypocotyl under salt stress after 12 h vs. control (PRJNA691982). 4 drought stress of resistant cultivar vs. control at 150 min after treatment. 5, Sensitive cultivar under drought stress vs. control (PRJNA508605). 6, fungal plant pathogen infected vs. non-infected samples of the resistant cultivar (PRJNA574280). 7, low-temperature stress of resistant common bean plant vs. control treatment (PRJNA793687).

