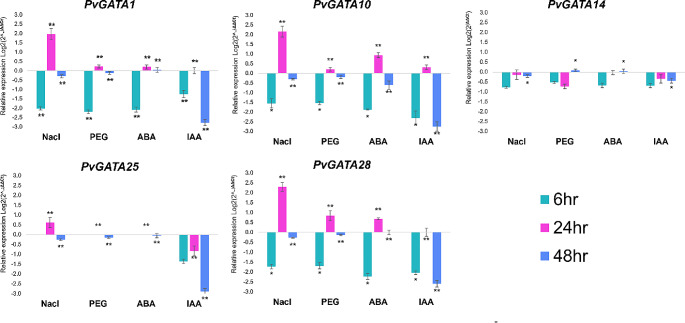
Fig. 7.
qRT-PCR expression profile analysis of five candidate PvGATA genes (PvGATA1, PvGATA10, PvGATA14, PvGATA25, and PvGATA28) under four different abiotic and phytohormone stress conditions, including Salinity stress (NaCl), Drought stress (PEG), Abscisic acid (ABA), and Indole acetic acid (IAA). Samples were collected from root tissues at three time points after treatment: 6-hour, 12-hour, and 48-hour. The experiments were performed independently with three replicates, and the error bars represent the standard deviation of three replicates. Asterisks indicate significant differences in transcript levels compared with the blank control. *P < 0.05, **P < 0.001

