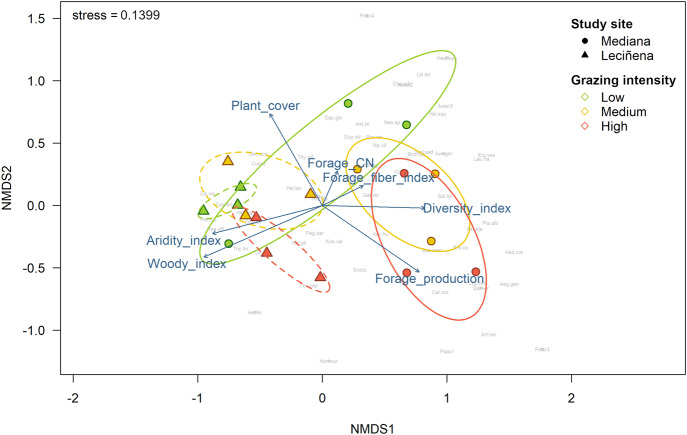
Fig. 2.
Non-metric multidimensional scaling (NMDS) ordination of study plots´ plant species composition using Bray-Curtis dissimilarity. Colors and symbols highlight different grazing intensities and sites, respectively. Ellipses indicate 95% confidence intervals (dashed and solid lines used for Leciñena and Mediana, respectively). Arrows show the correlation between measured variables and ordination axis scores. Note that lower values of the aridity index actually indicate higher aridity conditions. Full Latin names for the plant species labels are given in Supplementary Table S2

