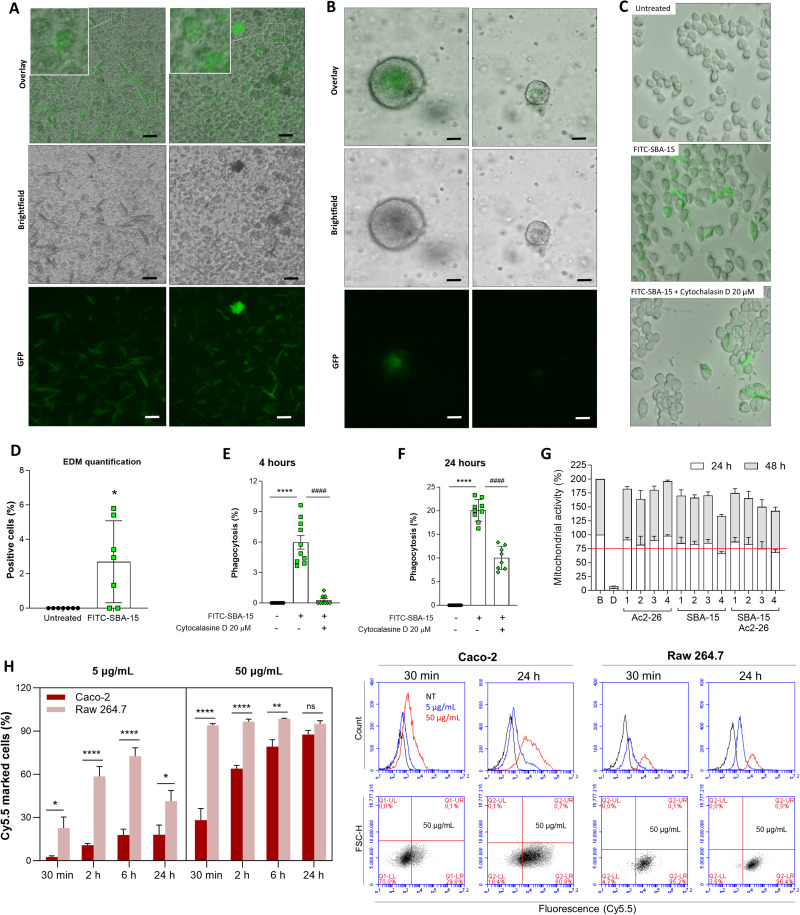
Figure 2.
(A) Representatives pictures from differentiated EDMs treated FITC-SBA for 24 hours. In All images, green inside the cells represent microparticles internalization. (B) Representative pictures showed 3D murine organoid challenged with microparticles and cultured for 6 days. (C) Representative pictures showed macrophages J774 challenged or not with microparticles for 24 hours in presence or absent of phagocytosis inhibitors (cytochalasin (D). (D) The percentage of microparticles uptake was determined. Determined by parametric Student’s t-test. (E and F) represent the uptake quantification of FITC-SBA after 4 hours (4h) and 24 hours (24h) after treatment. Scale bar represent 50 µm. Determined by One-Way ANOVA and Tukey multiple comparisons (G) Cytotoxicity by MTT assay using murine macrophages Raw 264.7. Ac2-26, SBA and Ac2-26-SBA concentrations 1, 2, 3 and 4 corresponding to 0.5, 5, 10 and 50 µg/mL respectively. Red line represents the 75% of mitochondrial activity. B, means cell incubated only with culture medium (Basal); D, means DMSO 10% treatment as positive control cytotoxicity. (H) Representative graph of Caco-2 or Raw 264.7 percentage of cells positive for Ac2-26-Cy5 at different time points: 30 minutes (30min), 2 hours, 6 hours and 24 hours. determined Two-Way ANOVA and Tukey multiple comparisons. The lower left side represents the Caco-2 and Raw 264.7 histogram median of fluorescence (upper line) and the percentage using forward scatter height (FSC-H) vs fluorescence emission for Cy5. Data obtained from the flow cytometry Accuri C6 software after 30 min and 24 hours. *<p 0.05, **<p 0.01 and ****p< 0.0001. ####p< 0.0001.

