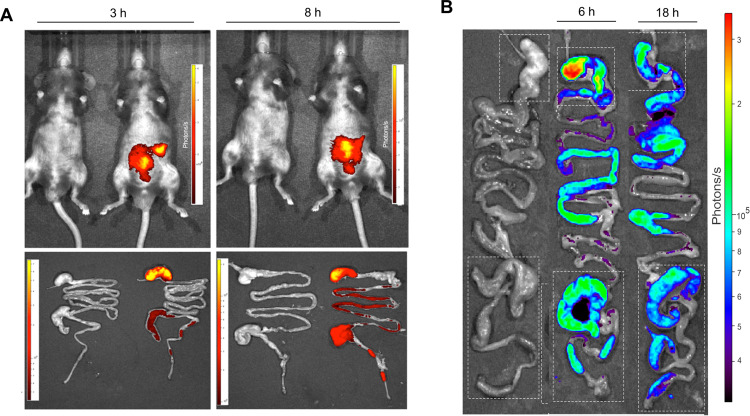
Figure 3.
Biodistribution along the TGI of Eudragit-SBA-Ac2-26Cy5.5 Eudragit-FITC-SBA-15. Mice were treated orally and the intensity of the distribution is represented by photons/s. (A) Eudragit-SBA-Ac2-26Cy5.5 distribution was analyzed after 3 hours and 8 hours in vivo (top) and the TGI analyzed separately ex vivo (botton) at the same time points. The yellow color represents the higher intensity in the tissue. (B) Eudragit-FITC-SBA-15 biodistribution ex vivo along the TGI after 6 hours and 18 hours. The red color represents the higher intensity in the tissue. The white square on the top is representing the stomach portion. The white square on the bottom is representing the large intestine portion.

