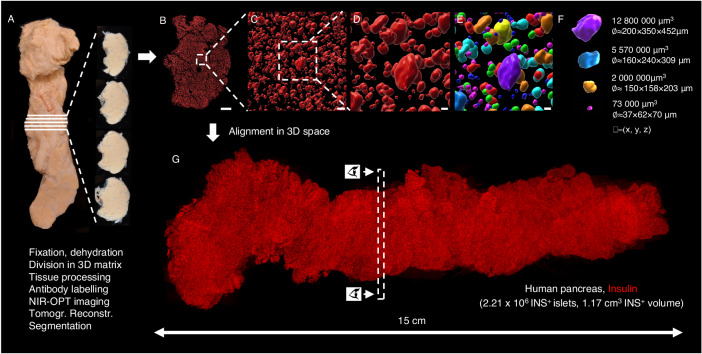
Fig. 1. Generation of volumetric and 3D-spatial data sets of the complete β-cell distribution across the human pancreas.
The intact pancreas (A) was fixed directly after procurement from a deceased donor (H2457, see Supplementary Table S1) and dehydrated in 100% ethanol. Using a 3D printed matrix, the pancreas was divided into 2.8 mm disks, with known spatial origins, allowing for penetration of tissue processing chemicals and antibodies. Each disc was scanned individually by NIR-OPT (see Supplementary Movie S1) or LSFM before offline segmentation and 3D rendering of individual islet β-cell volumes (B–F). In (E), each pseudo-colored object corresponds to a specific β-cell volume with known 3D coordinates. G By combining individual tomographic datasets in 3D space, new data sets could be created that encompass every insulin-stained object: in this case there were 2.21 × 10⁶ INS+ objects with a total volume of 1.17 cm3 (n = 1 donor pancreas subdivided in n = 51 pancreatic tissue disks), here displayed as a single 3D maximum intensity projection (see also Supplementary Movie S2 and Supplementary Fig. S3). Eye symbols in (G) illustrates the angle of view of disc shown in (B). Scale bar in (B) is 3000 μm, in (C) 200 μm and in (D, E) 70 μm.

