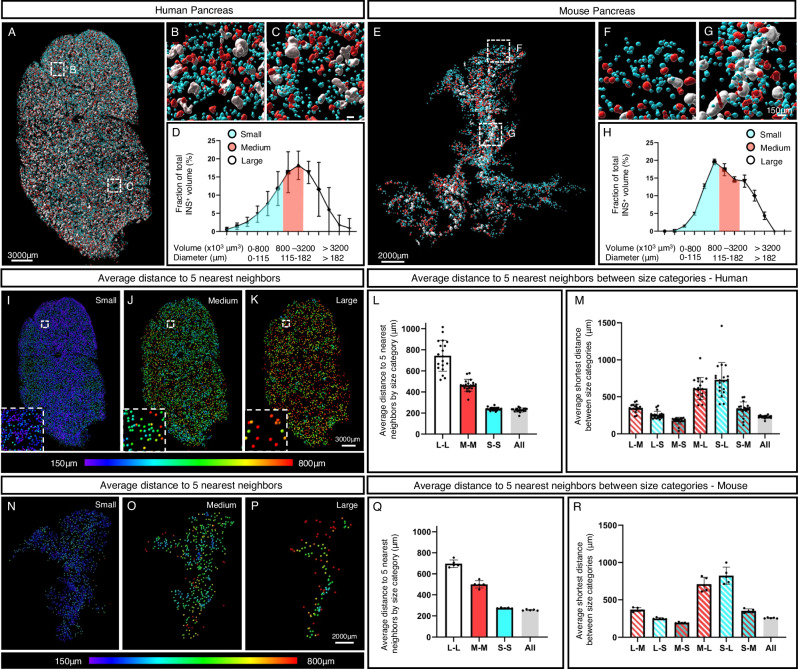
Fig. 3. Spatial arrangement and relative contribution of islet size categories in man and mice.
A–C Images of a representative pancreatic disc in which the insulin signal has been segmented and pseudo colored according to size. Each size category (blue, small (S); red, medium (M); white, large (L)) corresponds to 1/3 of the total β-cell volume. D Graph showing the volume of each INS+ islet size category represented as volumetric density normalized to the entire tissue volume, calculated from one disc from each region (1–4) in five donor pancreata (H2456, H2457, H2466, H2506 and H2522, see Supplementary Table S1). E–G Images of a representative mouse pancreas pseudo colored as in (A). H Graph showing the volume of each INS+ islet size category represented as volumetric density normalized to the entire tissue volume, calculated based on all INS+ islets in C57BL/6 pancreata at 10 weeks (n = 5, including 28108 INS+ islets). I–K Heat maps showing the average distance to the 5 nearest objects for each size category in the disc depicted in (A). Bar graphs showing the average distance to the 5 nearest neighboring objects (islets) by size category (L) and between size categories (M) calculated from one disc from each region (1–4, n = 20 tissue disks) from five donor pancreata (n = 5, H2456, H2457, H2466, H2506 and H2522, see Supplementary Table S1). “All” denotes the distance to the 5 nearest neighbors regardless of size category. GraphPad robust regression and outlier removal (ROUT) with Q = 1% identified H2422, R4, as an outlier and it was removed from the analyses. N–P Heat maps showing the average distance to the 5 nearest objects for each size category in the mouse pancreas depicted in (C). Bar graphs showing the average distance to the 5 nearest neighboring objects (islets) by size category (Q) and between size categories (R) based on all INS+ islets in C57BL/6 pancreata (n = 5). Note, the resolution limit of the scanner at the implemented zoom is 21 μm. Error bars show mean ± SDE. Source data are provided as a Source Data file.

