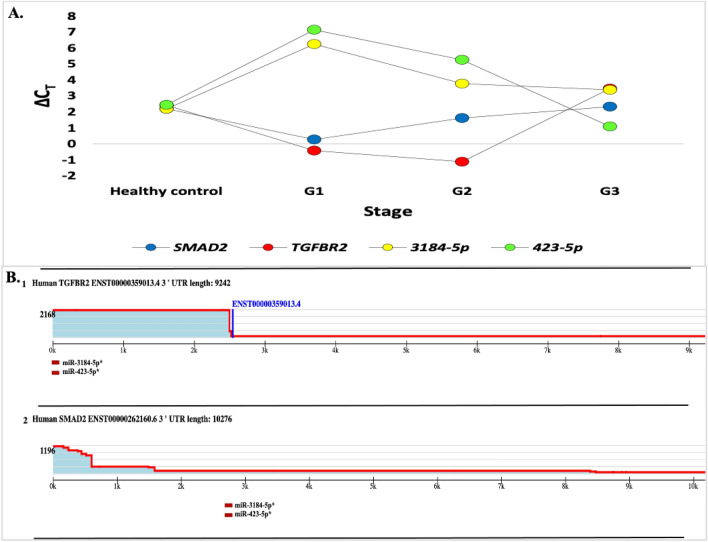
Figure 8.
(A) Verification results of upregulated miRNA. The Fold Change bar graph shows expression of SMAD2, TGFBR2, 3184-5p, and 423-5p genes. (B) TargetScanHuman figure for the 3′ UTR of the TGFβ R2, and SMAD 2. The 3′-UTR profile on the top presents the relative expression of 3′-UTR isoforms and the total number of 3P-seq reads. The profile presents Gencode annotation (red line), the conserved sites of the predicted target of miRNAs (boxes). The predicted site of miRNA up-regulation is miR-423-5p and miR-3184-5p(red boxes).

