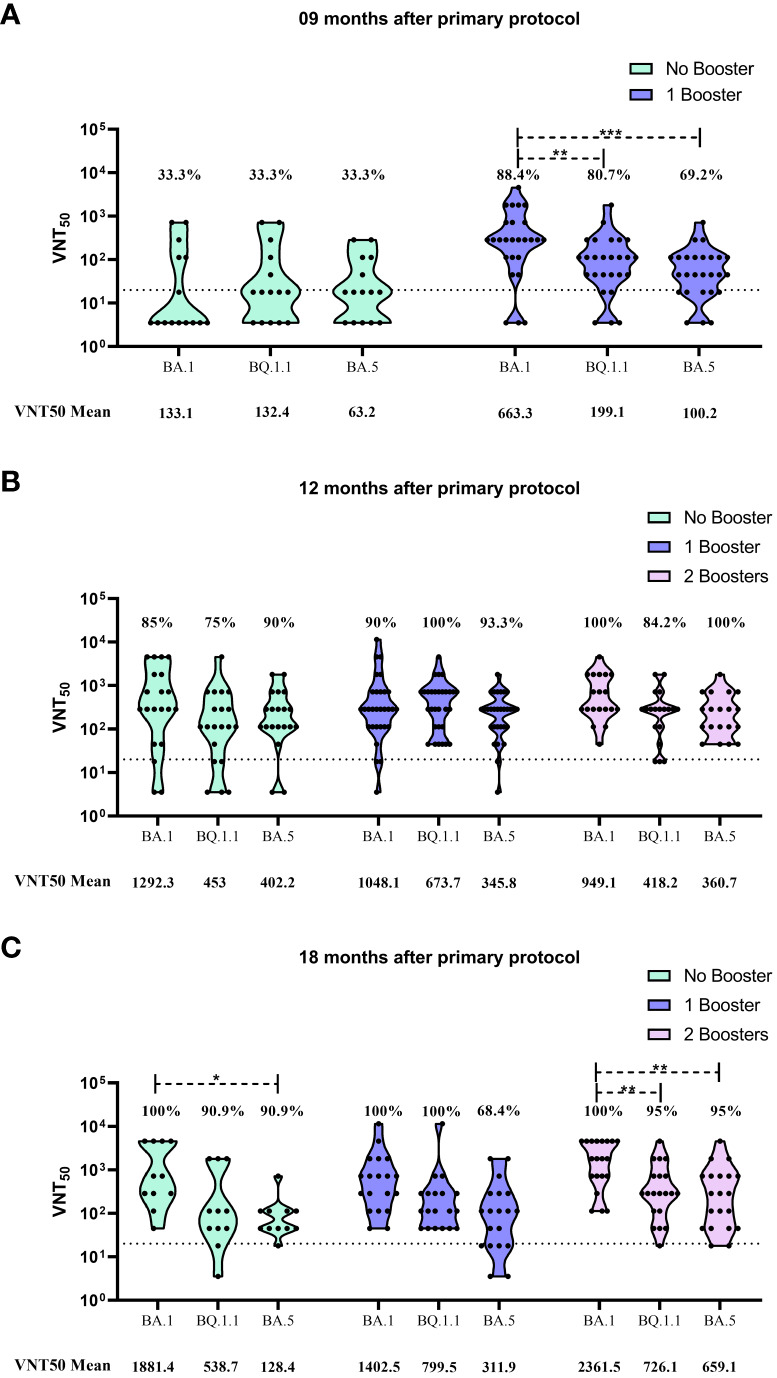
Figure 2.

Viral microneutralization assay against omicron sublineages to evaluate neutralization titers (VNT50) and seroconvertion rate. (A) VNT50 for samples collected 9 months after CoronaVac 2 doses protocol. (B) VNT50 for samples collected 12 months after CoronaVac 2 doses protocol; (C) VNT50 for samples collected 18 months after CoronaVac 2 doses protocol. Vaccination subgroups are represented in green (No booster), blue (1 booster) and pink (2 boosters). VNT50 means, for each group, are highlighted under the graphs. Dashed lines represent the seroconvertion dilution cutoff (1:20), while seroconvertion rates are defined as percentages. The significance lines represent the differences among the mean neutralization titers of the groups. It was considered p-values lower than 0.05 for the significance. One asterisk (*) = p-value < 0.05; two asterisks (**) = p-value < 0.01; and three asterisks (***) = p-value < 0.001.
