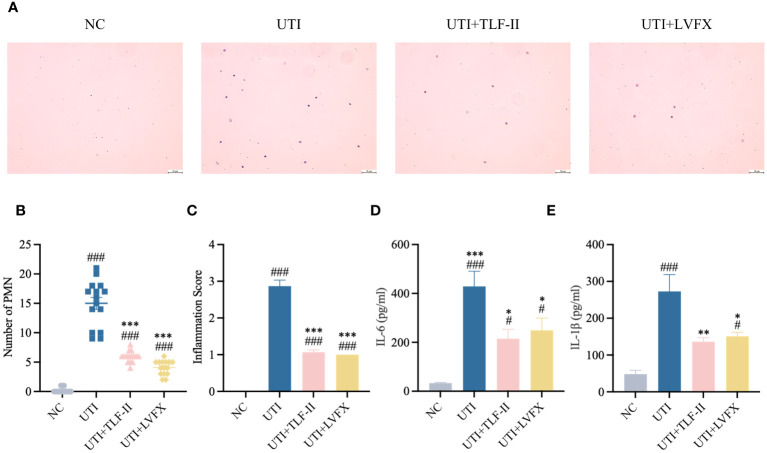
Figure 6.
TLF-II inhibits UTI–induced inflammatory responses. (A) Urinary sediments from each group of mice were stained and analyzed. Representative urine cytology images from each group (Scale bar = 50 μm). (B, C) Graphs showing polymorphonuclear leukocyte counts (B) and urine inflammation scores (C) per mouse after different interventions. (D, E) Serum levels of IL-6 (D) and IL-1β (E) determined by ELISA. Data are represented as mean ± SEM of three independent experiments. Significance is indicated as the p value, #p < 0.05, ###p < 0.001 vs. NC group; *p<0.05, **p < 0.01, ***p <0.001 vs. UTI group.

