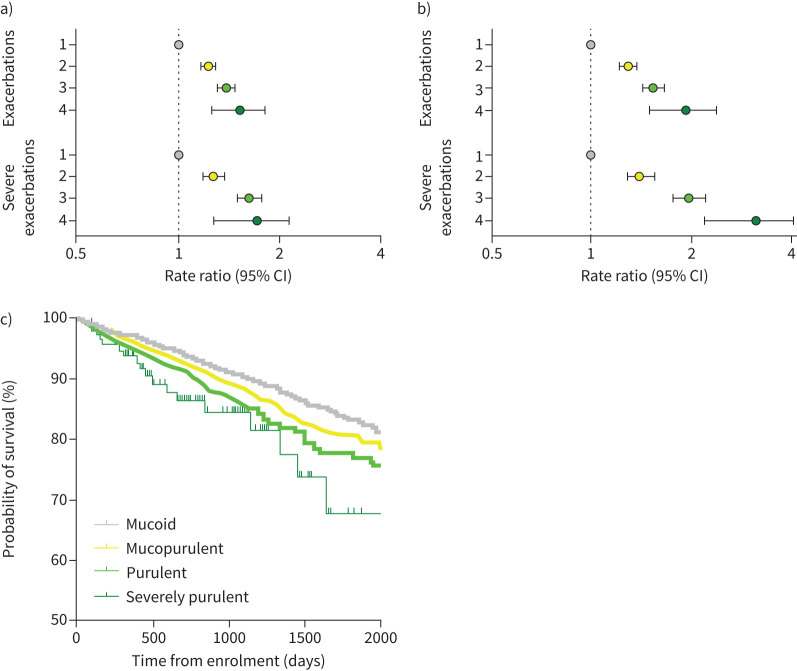
FIGURE 5.
a, b) Forest plots of the frequency of exacerbations and severe exacerbations across the four sputum colour groups (1=mucoid sputum (reference group), 2=mucopurulent sputum, 3=purulent sputum and 4=severely purulent sputum): a) in the previous year and b) during follow-up. c) Kaplan–Meier survival curve.

