FIGURE 1.

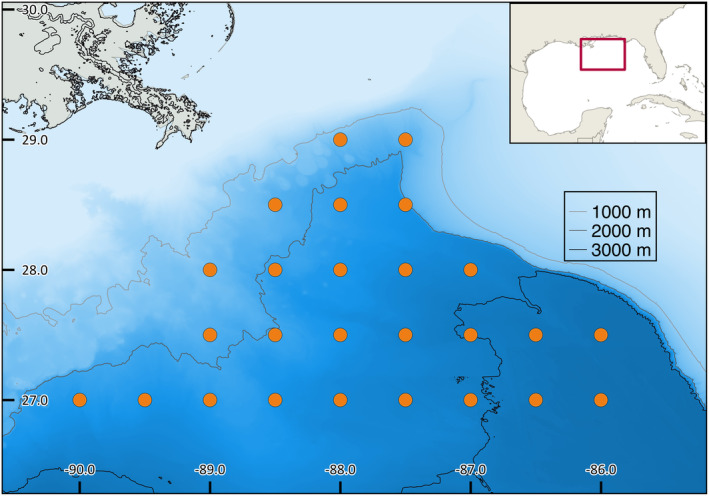
Map of the sampling locations. Station locations are indicated by the black dots, and depth is indicated according to color.

Map of the sampling locations. Station locations are indicated by the black dots, and depth is indicated according to color.