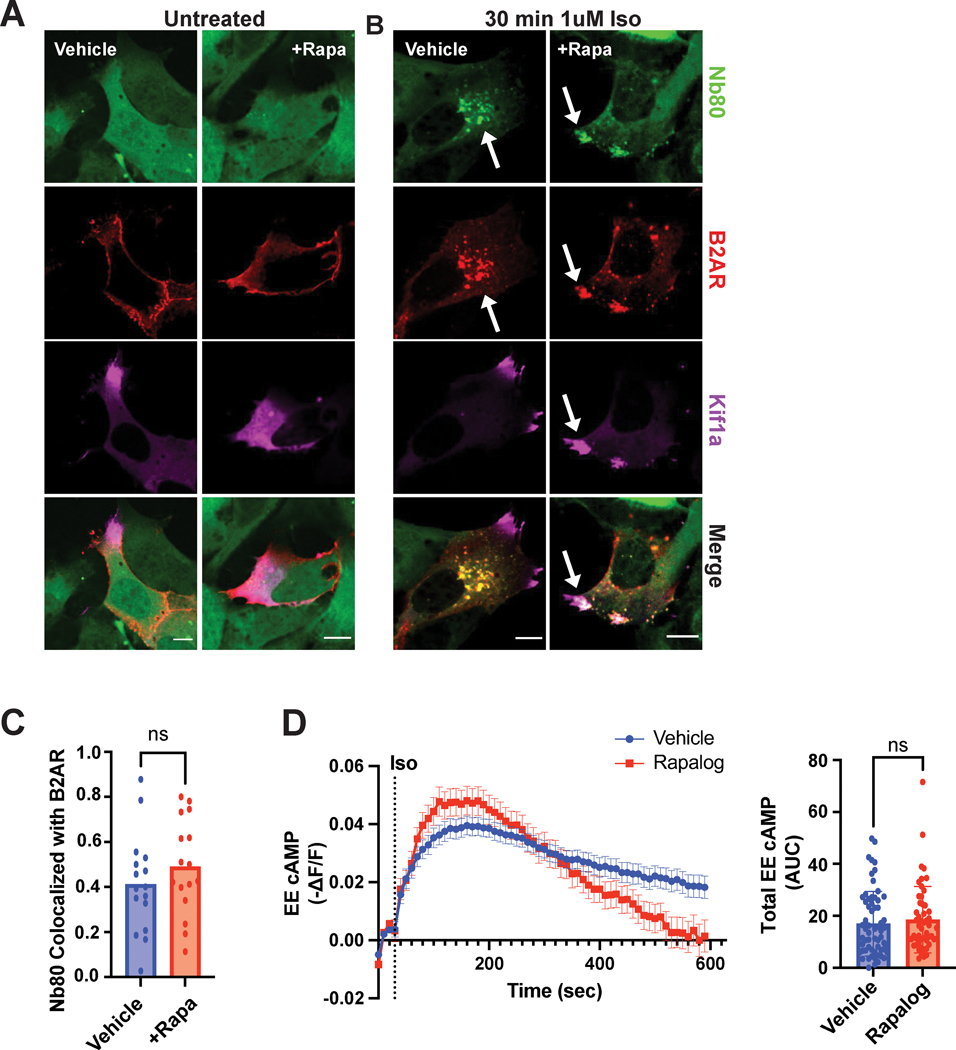
Figure 3. β2-AR on repositioned endosomes adopts an active conformation and stimulates Gas/cAMP signaling.
A-C. HEK293 cells were pre-treated with ethanol (“Vehicle”) or 1μM rapamycin (“+Rapa”) for 30 min. Flag-β2-AR (red) and Nb80(green) localization in untreated (A) and agonist-stimulated CID-expressing cells (B). A. Nb80 (green) is cytosolic in the absence of β2-AR stimulation. B. Redistributed endosomes containing Flag-β2-AR colocalize with Nb80 following 1μM isoproterenol treatment for 30 min. White arrows indicate examples of colocalization between Nb80 with β2-AR. Scale bar = 10μm. C. Fraction of co-localized β2-AR and Nb80 in control and rapamycin-treated cells. Data are mean from n = 2 biologically independent replicates; 16 cells total/condition. ns by unpaired two-tailed Student’s t-test. D. Cells expressing Flamindo2-FRB-EEA1 and kinesin-FKBP were pre-treated with ethanol (“Vehicle”) or 1μM AP21967 (“Rapalog”) for 30 min before 1μM isoproterenol stimulation. The delta F/F (ΔF/F) ratio was measured every 10 sec and transformed by −1 (left). Total cAMP produced was quantified by calculating the area under the curve (AUC, right). Data are mean from n = 12 (“Vehicle”) and n = 19 (“Rapalog”) biologically independent replicates ± s.e.m.; 52–63 cells total/condition. ns by unpaired two-tailed Student’s t-test.

