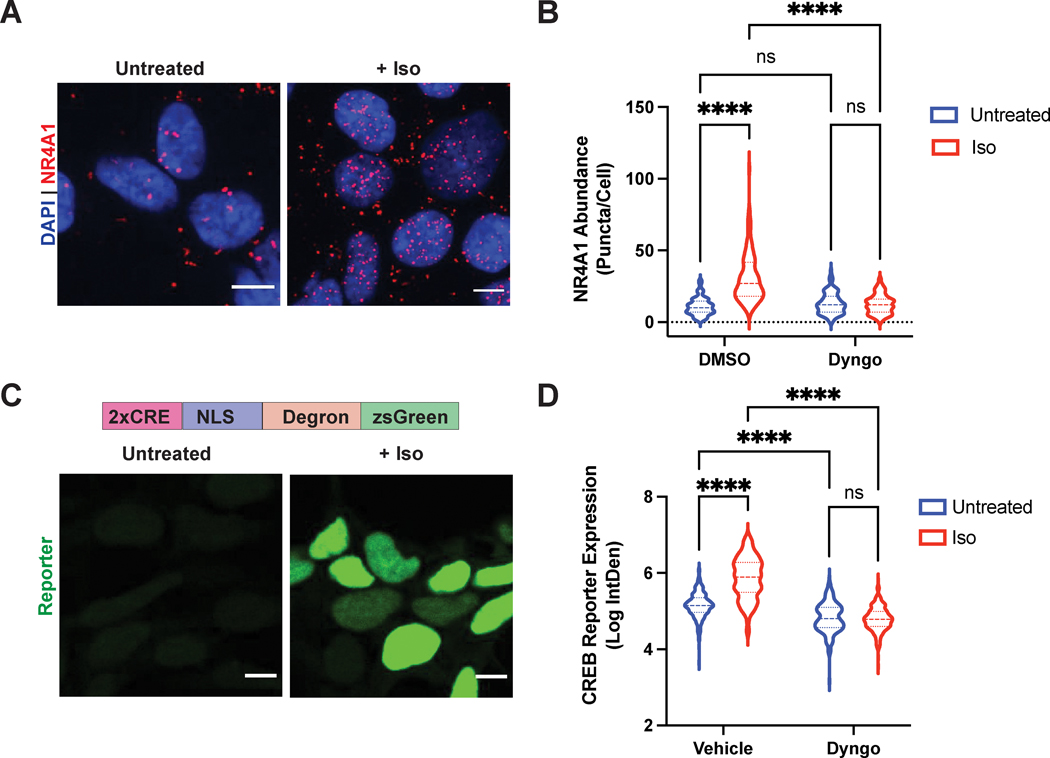
Figure 4. Single-cell optical readouts of GPCR-dependent transcriptional signaling.
A. Representative images of NR4A1 mRNA expression by PLISH analysis. Left: untreated; right: treated with 1μM isoproterenol for 2 h. B. Quantification of NR4A1 induction in cells pre-treated with DMSO (“Vehicle”) or 30μM Dyngo-4A for 20 min, then stimulated with 1μM isoproterenol for 2 h. Data are mean from n = 4 biologically independent replicates ± s.e.m.; 132 cells total/condition. C. Representative images of CREB reporter expression in pCRE-NLS-DD-zsGreen1 cells. Schematic of the reporter is shown on top. CRE = cAMP response element; NLS = nuclear localization sequence. Left: untreated in the presence of 1μM Shield-1 for 4 h; right: treated with 1μM isoproterenol in the presence of 1μM Shield for 4 h. D. Quantification of CREB reporter induction in cells pre-treated with DMSO (“Vehicle”) or 30μM Dyngo-4A for 20 min, then stimulated with 1μM isoproterenol for 4 h in the presence of 1μM Shield. Data are mean from n = 3 biologically independent replicates ± s.e.m.; 225 cells total/condition. **** = p < 0.0001 by two-way ANOVA test with Tukey. Scale bar = 10μm.

