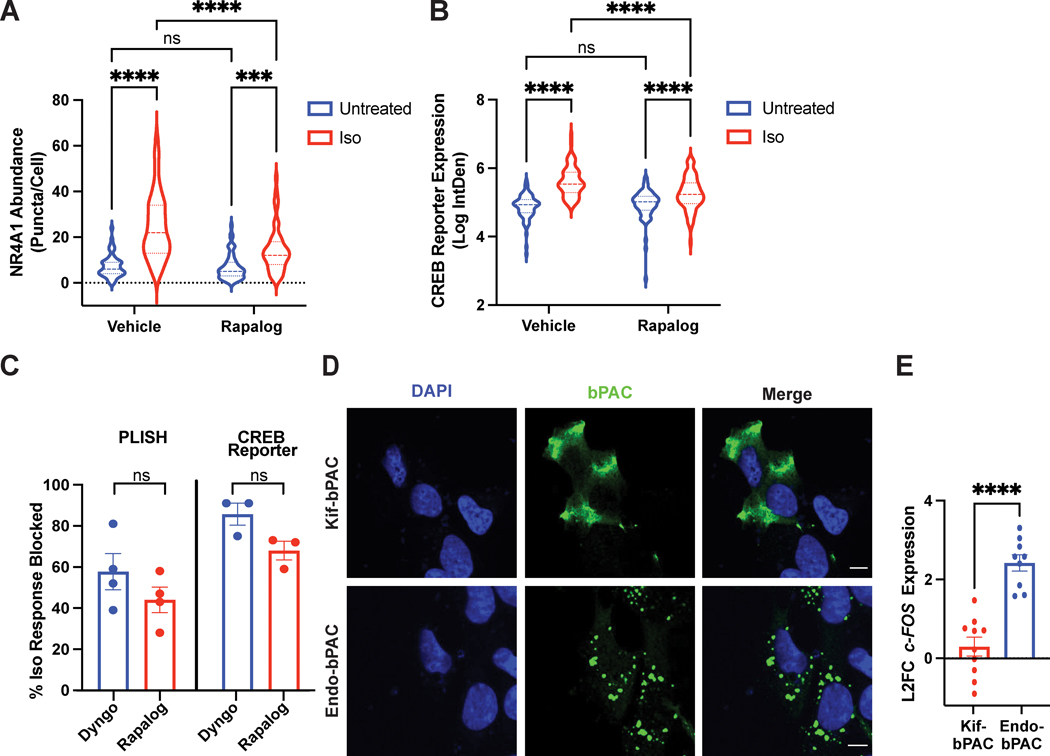
Figure 5. Endosome positioning is critical for site-selective signaling.
A-C. Cells expressing the CID system were pre-treated with ethanol (“Vehicle”) or 1μM AP21967 (“Rapalog”) for 30 min before agonist stimulation. A. NR4A1 mRNA expression by PLISH analysis of untreated or isoproterenol-stimulated cells (“Iso”, 1μM, 2 h). Data are mean from n = 4 biologically independent replicates ± s.e.m.; 55 cells total/condition. **** = p < 0.0001, *** = p < 0.001 by two-way ANOVA test with Tukey. B. CREB reporter expression in pCRE-NLS-DD-zsGreen1 cells untreated in the presence of 1μM Shield or stimulated with 1μM isoproterenol (“Iso”) in the presence of 1μM Shield for 4 h. Data are mean from n = 3–4 biologically independent replicates ± s.e.m.; 70–77 cells total/condition. **** = p < 0.0001 by two-way ANOVA test with Tukey. C. Endosome positioning regulates the initiation of cAMP-dependent gene transcription to a comparable extent as β2-AR endocytosis. Shown are % inhibition of the isoproterenol-induced transcriptional response from PLISH (left) and CREB reporter (right) analyses. Data are mean from n = 3 (“CREB Reporter”) and n = 4 (“PLISH”) biologically independent replicates ± s.e.m. and analyzed by unpaired two-tailed Student’s t-test. D. Representative images of bPACs (green) localized to the periphery by fusion to a kinesin motor (“Kif-bPAC”, top) or to the early endosome by fusion to a 2X-FYVE domain (“Endo-bPAC”, bottom). Cells were visualized by immunofluorescence microscopy following staining with Alexa 647-conjugated anti-myc antibody. Representative images are selected from n = 2 biologically independent experiments. E. c-FOS induction measured by RT-qPCR analysis after bPAC photostimulation for 3 min. Data represent mean from n = 9 (“Endo-bPAC”) and n = 10 (“Kif-bPAC”) biologically independent replicates ± s.e.m. **** = p < 0.0001 by unpaired two-tailed Student’s t-test. Scale bar = 10μm.

