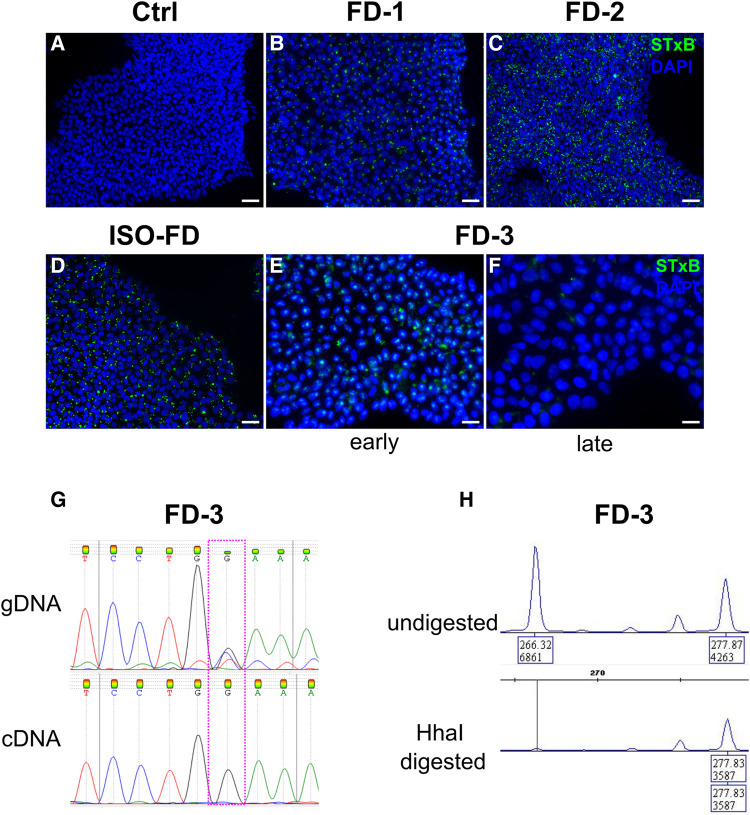
Figure 1.
Gb3 accumulations in iPSC and skewed XCI. (A) Ctrl-iPSC show no Gb3 accumulations. Scale bar: 50 μm. (B)–(D) FD-1, FD-2 and ISO-FD iPSC display numerous Gb3 accumulations. Scale bars: 50 μm. (E) iPSC from the female FD-3 line shows Gb3 accumulations in early passages. Scale bar: 25 μm. (F) Gb3 accumulations are lost in iPSC of FD-3 during cultivation (>10 passages). Scale bar: 25 μm. (G) Analysis of gDNA via Sanger sequencing shows the expected heterozygous disease–associated mutation, whereas analysis of cDNA from late FD-3 cells (>10 passages) shows the wild-type sequence. (H) Analysis of X-chromosomal inactivation in late passage (>10 passages) by methylation-sensitive fragment analysis of the polymorphic (CAG)n repeat in the AR gene. FD-3 cells show a complete shift towards one allele. Ctrl, control; DAPI, 4′,6-diamidino-2-phenylindole; FD-1, FD-2, FD-3, patients with Fabry disease; ISO-FD, isogenic Fabry line.

