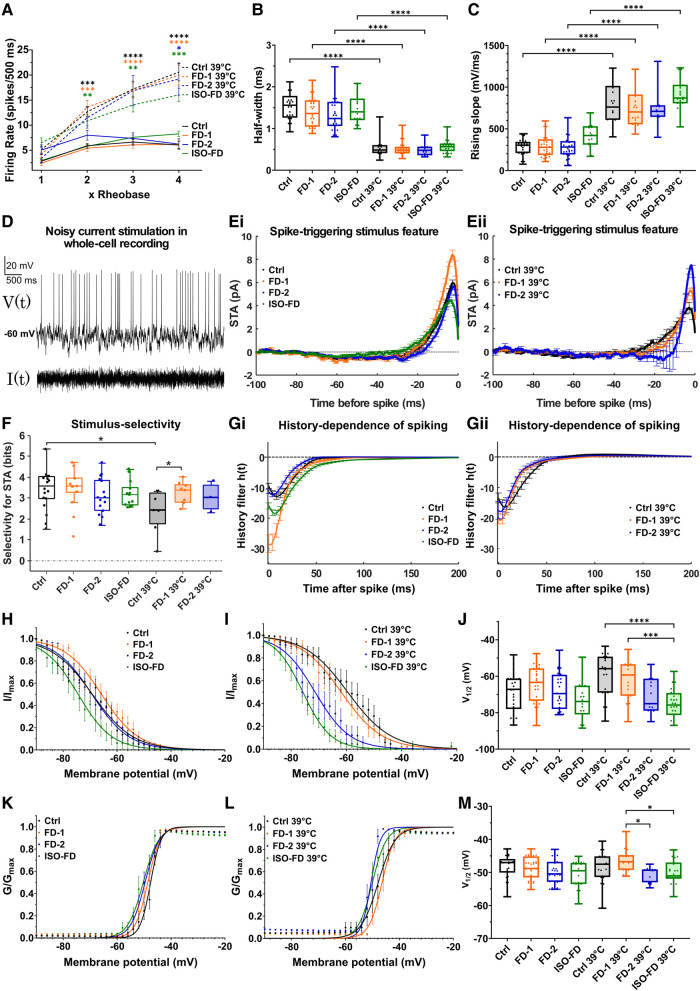
Figure 5.
Electrophysiological characterization of sensory neurons. (A) No differences were found in action potential firing rates upon injection of 1×, 2×, 3× and 4× rheobase current between cell lines. Increased firing rates were observed at 39°C compared with RT at 2× and 3× rheobase for Ctrl (n = 2 clones; RT: Clone 1 = 7 cells, Clone 2 = 21 cells; 39°C: Clone 1 = 16 cells, Clone 2 = 4 cells), FD-1 (n = 2 clones; RT: Clone 1 = 11 cells, Clone 2 = 16 cells; 39°C: Clone 1 = 18 cells, Clone 2 = 5 cells) and ISO-FD (n = 1 clone; RT: 19 cells, 39°C: 26 cells) neurons. At 4× rheobase, all cell lines (FD-2: n = 2 clones; RT: Clone 1 = 5 cells, Clone 2 = 18 cells; 39°C: Clone 1 = 15 cells) showed increased firing rates at 39°C compared with RT. Data are represented as mean ± SEM. Two-way ANOVA [F(21, 513) = 12.43, P < 0.0001] followed by Sidak’s multiple comparison correction. (B) Half-width of action potentials was comparable between all cell lines at RT and 39°C. Reduced half-widths at 39°C for all cell lines compared with RT. Linear mixed-effects model analysis accounting for repeated measurements (different clones per cell line) followed by Bonferroni’s multiple comparison correction. Detailed test statistics are given in Supplementary Table 4. (C) Rising slope of action potentials was not different between the cell lines at RT and 39°C. Increased rising slopes at 39°C for all cell lines compared with RT. Linear mixed-effects model analysis accounting for repeated measurements (different clones per cell line) followed by Bonferroni’s multiple comparison correction. Detailed test statistics are given in Supplementary Table 5. (D) Neurons were stimulated with Gaussian white current in patch-clamp whole-cell recordings: voltage response (upper) and noisy stimulus (lower). Representative recording was shown. (E) STA illustrates mean current eliciting action potentials calculated via spike-triggered reverse correlation. Positive values indicate depolarizing current; t = 0 indicates the time of spiking. At RT, FD-1 neurons required a larger depolarizing STA compared with the other cell lines (Ei). At 39°C, both FD cell lines encoded larger depolarizations compared with Ctrl (Eii). Data are represented as mean ± SEM. (F) Stimulus selectivity for STAs shown in Ei and Eii measured in bits was comparable between the cell lines at RT but increased in FD-1 at 39°C. Large values indicate high selectivity for STA, i.e. the spike-triggering subspace defined by STA is very different from the overall Gaussian stimulus distribution. Rank-sum test. (G) History dependence of neuron populations, , calculated via generalized linear model framework (see ‘Materials and methods’ section) showed a higher refractoriness of FD-1 compared with the other cell lines at RT (Gi), which largely disappeared at 39°C (Gii). Data are represented as mean ± SEM. (H) Steady-state inactivation curves of voltage-gated sodium channels at RT. ISO-FD neurons showed negative shift of inactivation compared with Ctrl. Data are represented as mean ± SEM. (I) Steady-state inactivation curves of voltage-gated sodium channels at 39°C. FD-2 and ISO-FD neurons displayed negative shift of inactivation compared with Ctrl. Data are represented as mean ± SEM. (J) V1/2 steady-state inactivation was comparable among Ctrl, FD-1, FD-2 and ISO-FD neurons at RT. However, at 39°C, V1/2 was decreased in ISO-FD, and FD-2 showed a trend towards decreased V1/2 compared with Ctrl and FD-1. One-way ANOVA [F(7, 183) = 6.68, P < 0.0001] followed by Sidak’s multiple comparison correction. (K) Steady-state activation curves of voltage-gated sodium channels at RT were comparable between the cell lines at RT. Data are represented as mean ± SEM. (L) Steady-state activation curves of voltage-gated sodium channels at 39°C displayed a negative shift of FD-2 and ISO-FD compared with Ctrl and FD-1. Data are represented as mean ± SEM. (M) V1/2 steady-state activation was comparable among Ctrl, FD-1, FD-2 and ISO-FD neurons at RT. At 39°C, V1/2 showed a trend towards decreased values for FD-2 and ISO-FD compared with Ctrl. One-way ANOVA [F(7, 184) = 3.64, P < 0.01] followed by Sidak’s multiple comparison correction. For (B, C, H–M): for Ctrl (n = 2 clones; RT: Clone 1 = 8 cells, Clone 2 = 21 cells; 39°C: Clone 1 = 16 cells, Clone 2 = 4 cells), FD-1 (n = 2 clones; RT: Clone 1 = 15 cells, Clone 2 = 16 cells; 39°C: Clone 1 = 18 cells, Clone 2 = 5 cells), FD-2 (n = 2 clones; RT: Clone 1 = 11 cells, Clone 2 = 18 cells; 39°C: Clone 1 = 15 cells) and ISO-FD (n = 1 clone; RT: 19 cells, 39°C: 26 cells) pooled data obtained from ≥3 individual differentiations were used. For (D–G): group sizes for RT and (39°C) were n = 18 (7), 14 (9), 15 (3) and 13 (4) for Ctrl, FD-1, FD-2 and ISO-FD, respectively. Data were pooled from two clones per cell line (exc. ISO-FD). For (B, C, F, J and M): each data point represents measurement of one cell. Data are represented as box-and-whisker plots with dots as individual values. The box width indicates the first and third quartiles, the line indicates the median and the whiskers of the box plot indicate the smallest and largest values. Ctrl, control; FD-1, FD-2, patients with Fabry disease; ISO-FD, isogenic Fabry line. *P < 0.05; **P < 0.01; ***P < 0.001; ****P < 0.0001.

