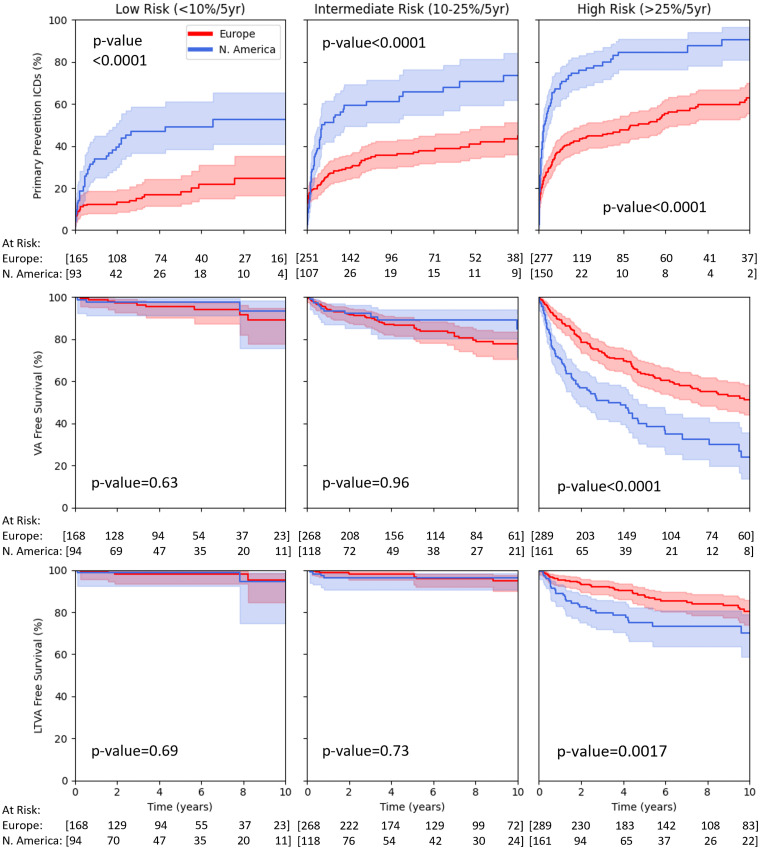
Figure 2.
Cumulative rates of (top row) primary prevention ICD implantation, (centre row) sustained VA-free survival, and (bottom row) LTVA-free survival (defined as VT at >250 b.p.m. or aborted SCD) in low-risk (left column; <10% 5-year VA risk), intermediate-risk (middle column; 10%–25% 5-year VA risk), and high-risk (right column; >25% 5-year VA risk) sub-groups according to geographic cohort. Shaded areas present 95% confidence intervals. Statistical significance was assessed using log-rank testing.

