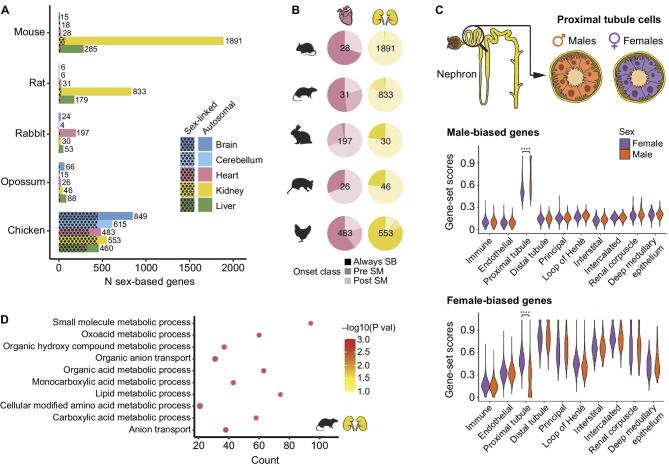
Figure 4:
Sex-biased gene expression in the kidney. (A) Number of sex-biased genes by species and organ. Spotted pattern indicates genes located on sex chromosomes. (B) Percentage of sex-biased genes belonging to each of the onset classes: always sex-biased (Always SB), sex-biased pre–sexual maturity (Pre SM), or sex-biased post–sexual maturity (Post SM). Shown is the total number of sex-biased genes per organ and species inside each pie plot. (C) Distribution of male-biased (up) and female-biased (down) gene-set scores according to cell type and separated by male and female cells in adult mouse kidney scRNA-seq dataset (data from [92]) (**** adjusted P < 0.0001). (D) Enriched biological processes among genes that become sex biased after sexual maturity in rat kidney (n = 688; adjusted P < 0.05). Reproduced with permission from Ref 92.

