Figure 1.
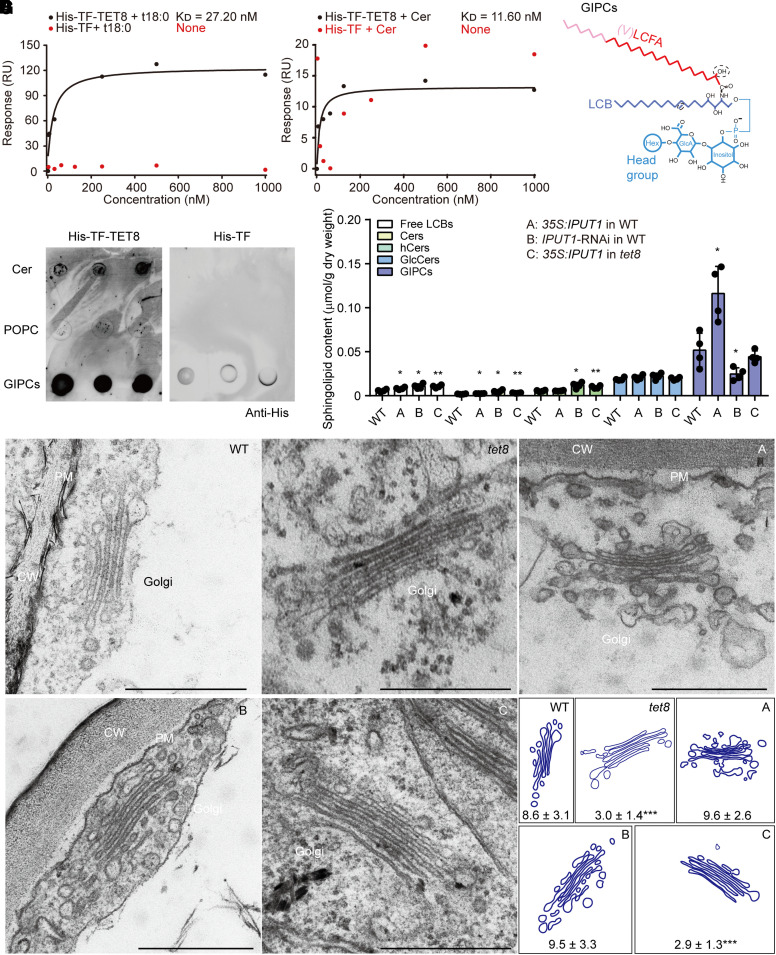
TET8 interacts with sphingolipids and acts as a GIPC carrier. A) SPR analysis of recombinant His-TF-TET8 protein with t18:0. B) SPR analysis of recombinant His-TF-TET8 protein with Cer t18:0-c24:0. In A) and B), the KD (affinity) values were calculated based on the fitting curves and represent the binding affinity between protein and lipid. None, the molecule cannot bind to the target protein His-TF (negative control). C) Molecular structure of GIPC. The red line represents the long-chain fatty acid (LCFA), the pink part represents the very-long-chain fatty acid (VLCFA), the purple part represents long-chain base (LCB), and blue lines represent the head group of GIPC. D) Lipid strip assays showing that GIPCs can bind to His-TF-TET8. Same amounts of different lipids were spotted onto a PVDF membrane. Cer (t18:0-c24:0) and POPC (16:0-18:1) were used as a positive and negative control, respectively, for GIPCs. Recombinant His-TF protein was used as a negative control for His-TF-TET8. E) The sphingolipid profiles of WT, 35S:IPUT1 in WT (A), IPUT1-RNAi in WT (B), and 35S:IPUT1 in tet8 (C). Four independent repeats (see black dots) were conducted. Data are shown as means ± Sd. Statistical significance was determined using Student's t test. *P < 0.05; **P < 0.01. Details are listed in Supplemental Data Set 2. F, G) Golgi observations F) and analysis of leaf cells from 4-wk-old plants of WT, tet8, 35S:IPUT1 in WT (A), IPUT1-RNAi in WT (B), and 35S:IPUT1 in tet8 (G). CW, cell wall; PM, plasma membrane. Scale bars, 500 nm. The number of vesicles around the Golgi is represented as means ± Sd. Statistical significance was determined between WT and other plants using Student's t test. ***P < 0.001.

