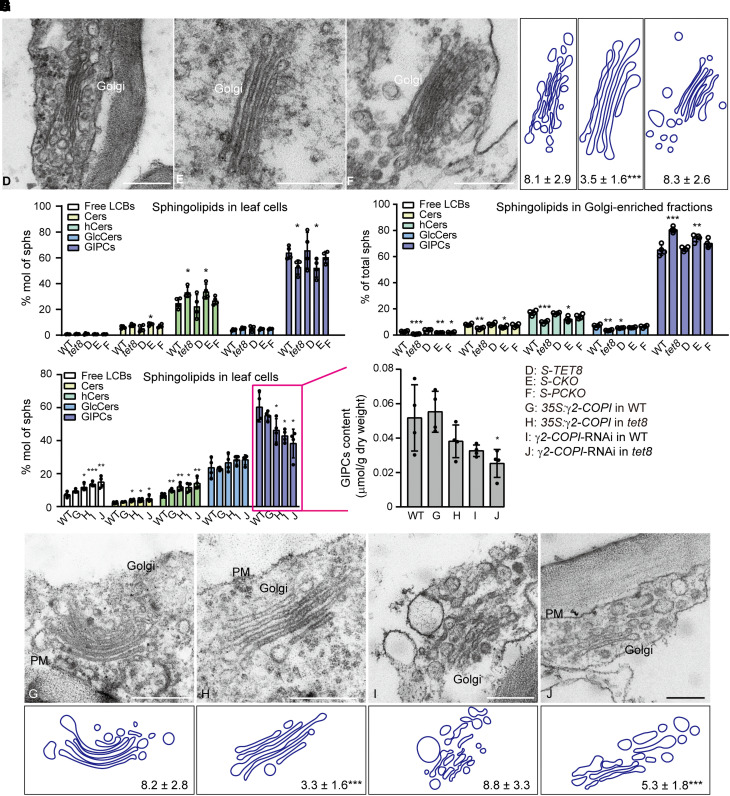
Figure 3.
The TET8 regulates Golgi vesicle budding and modulates GIPC exports. A) TEM observations of the Golgi in the leaves of 4-wk-old plants from S-TET8 (D), S-CKO (E), and S-PCKO (F). Scale bars, 500 nm. B) Number of Golgi vesicles. C) Sphingolipid profiles of leaf cells in WT, tet8, S-TET8 (D), S-CKO (E), and S-PCKO (F). D) Sphingolipid profiles of Golgi-enriched fractions extracted from WT, tet8, S-TET8 (D), S-CKO (E), and S-PCKO (F). E) Sphingolipid profiles of leaf cells in WT, 35S:γ2-COPI in WT (G), 35S:γ2-COPI in tet8 (H), γ2-COPI-RNAi in WT (I), and γ2-COPI-RNAi in tet8 (J). F) Content of leaf GIPCs in WT, 35S:γ2-COPI in WT (G), 35S:γ2-COPI in tet8 (H), γ2-COPI-RNAi in WT (I), and γ2-COPI-RNAi in tet8 (J). G) TEM observation of the Golgi in the leaves of 4-wk-old plants from 35S:γ2-COPI in WT (G), 35S:γ2-COPI in tet8 (H), γ2-COPI-RNAi in WT (I), and γ2-COPI-RNAi in tet8 (J). Scale bars, 500 nm. PM, plasma membrane. H) Number of Golgi vesicles. For B) and H), the number of vesicles around the Golgi is shown as means ± Sd. Statistical significance was determined using Student's t test. ***P < 0.001. For C to E), all data are represented as mol % of total sphingolipids. For C to F), 4 independent repeats (shown as black dots) were conducted. Data are presented as means ± Sd. Statistical significance was determined using Student's t test. *P < 0.05; **P < 0.01; ***P < 0.001. Details are given in Supplemental Data Sets 4 to 6.

