Figure 5.
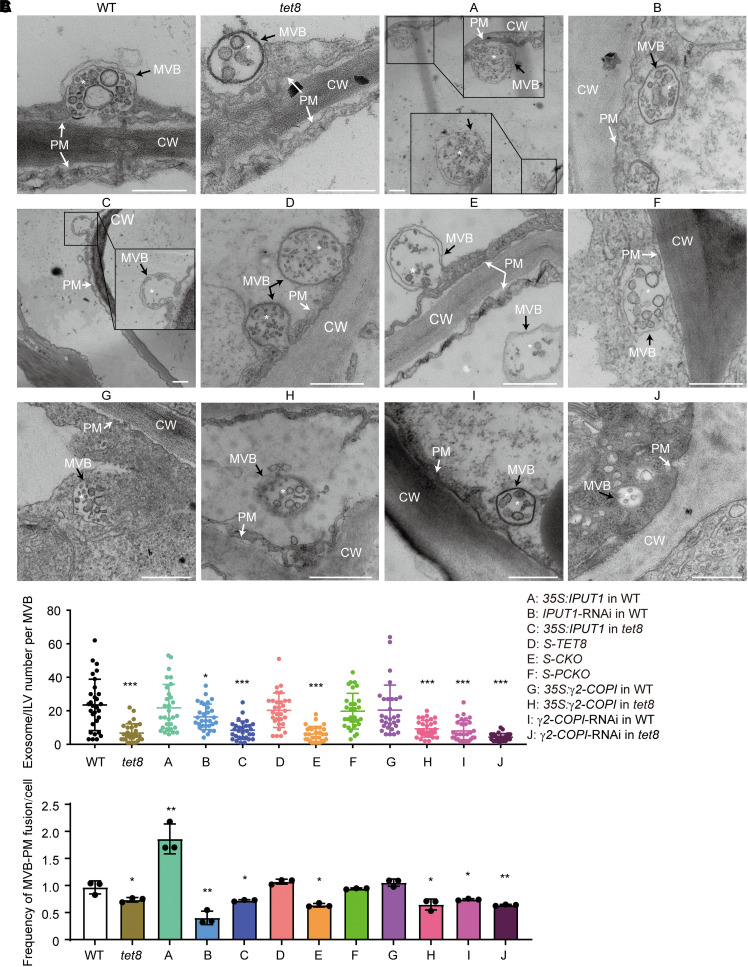
The TET8 and GIPCs together regulate plant MVB maturation. A) TEM observation of MVBs in WT, tet8, 35S:IPUT1 in WT (A), IPUT1-RNAi in WT (B), 35S:IPUT1 in tet8 (C), S-TET8 (D), S-CKO (E), S-PCKO (F), 35S:γ2-COPI in WT (G), 35S:γ2-COPI in tet8 (H), γ2-COPI-RNAi in WT (I), and γ2-COPI-RNAi in tet8 (J). CW, cell wall; MVBs, multivesicular bodies (black arrows); PM, plasma membrane (white arrows). White asterisks indicate ILV in the MVB. Scale bars, 500 nm. B) Number of ILVs in MVBs (n = 30 for each group, marked as dots in different colors). Statistical significance was determined using Mann–Whitney U test. C) Frequency of MVBs fusing with the PM. Three independent repeats (black dots) were conducted. Data are reported as means ± Sd. Statistical significance was determined using Student's t test. *P < 0.05; **P < 0.01; ***P < 0.001.

