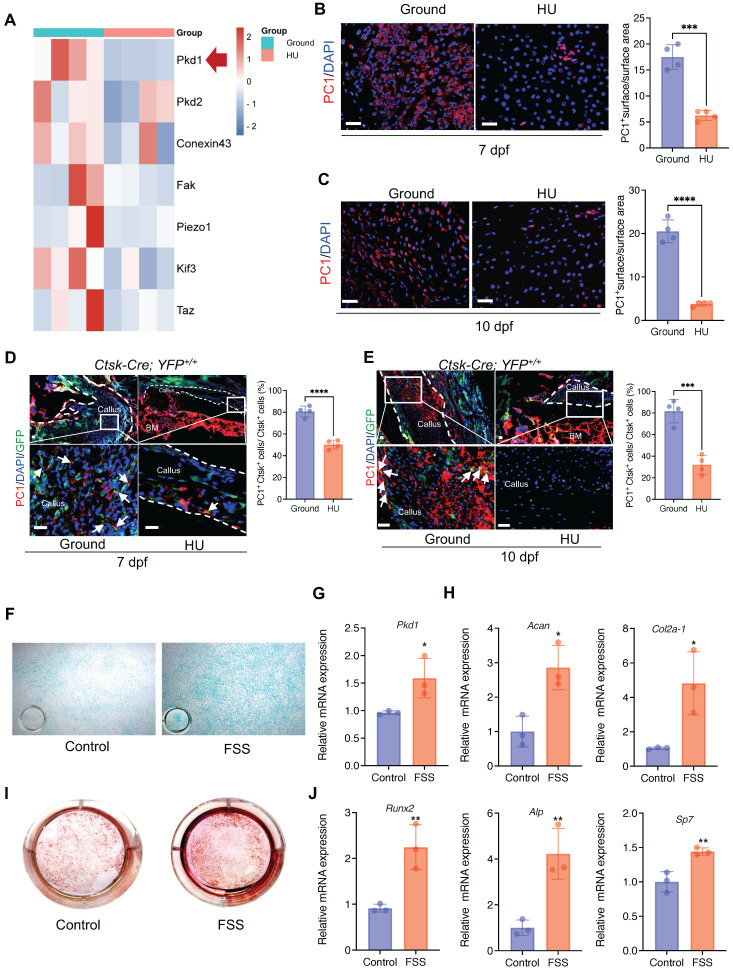
Figure 2.
Mechanical stimulus affects polycystin-1 level in Ctsk+ PSPCs. A Mechanosensitive gene expression levels in callus from fracture mice at 10 days post-fracture (n = 4). B, C Representative IF images of fracture callus at 7 days and 10 days post-fracture, immunostained with Ctsk (green) and PC1 (red) antibodies and counterstained with DAPI (blue). Dotted squares indicate areas magnified in Periosteum. Scale bars = 100 μm. Immunofluorescence intensity was quantified using ImageJ software (n = 4). D, E Representative IF images of fracture callus at 7- and 10-days post-fracture in Ctsk-Cre; YFP+/+ mice, immunostained with Ctsk (green) and PC1 (red) antibodies and counterstained with DAPI (blue). White squares indicate magnified areas in callus. White arrows indicate co-localization of PC1 level in Ctsk positive cells. Immunofluorescence intensity was quantified using ImageJ software (n = 4). F, I Representative images of Alcian blue staining (F)and Alizarin Red staining (I) of PSPCs with fluid shear stress (FSS). G, H, J qPCR analysis of the efficiency of Pkd1 gene knockout (G), chondrogenic-related genes expression (H) and osteogenic-related genes expression (J) in PSPCs with control and FSS treatment (n = 3). Scale bars = 100 μm. Data are shown as mean ± SD. *p < 0.05, **p < 0.01, ***p < 0.001 and **** p < 0.0001. ns, no significance.

