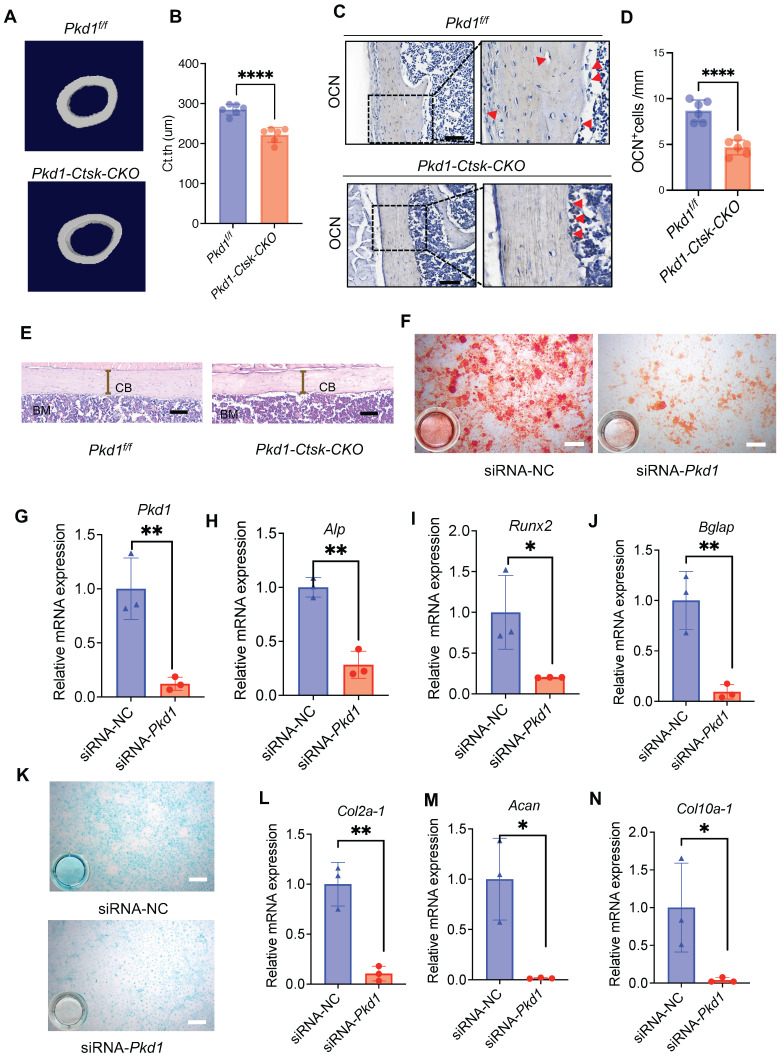
Figure 3.
Pkd1 deletion in Ctsk+ PSPCs impairs bone formation. A, B μCT images in femurs from 8-week-old male Pkd1-Ctsk-CKO mice (A) and quantitative analysis of the indicated parameters in Pkd1-Ctsk-CKO mice (B), respectively (n = 6). C, D Representative images of OCN immunohistochemical staining with analysis of number of osteogenic potentials of PSPCs (scalebar = 100 μm; n = 6). E Representative images of H&E staining with analysis of cortical thickness. Scale bars indicates 100 μm. F Representative images of Alizarin Red staining of PSPCs with transfection of siRNA-NC or siRNA-Pkd1. G qPCR analysis of Pkd1 gene expression levels in PSPCs transfected with siRNA-NC or siRNA-Pkd1 (n = 3). Scale bar indicates 100 μm. H-J qPCR analysis of osteogenic-related genes expression in PSPCs transfected with siRNA-NC or siRNA-Pkd1 (n = 3). K Representative images of Alcian blue staining of PSPCs with transfection of siRNA-NC or siRNA-Pkd1. Scale bar indicates 100 μm. L-N qPCR analysis of chondrogenic-related genes expression in PSPCs transfected with siRNA-NC or siRNA-Pkd1 (n = 3). Data are shown as mean ± SD. *p < 0.05, **p < 0.01 and **** p < 0.0001. ns, no significance.

