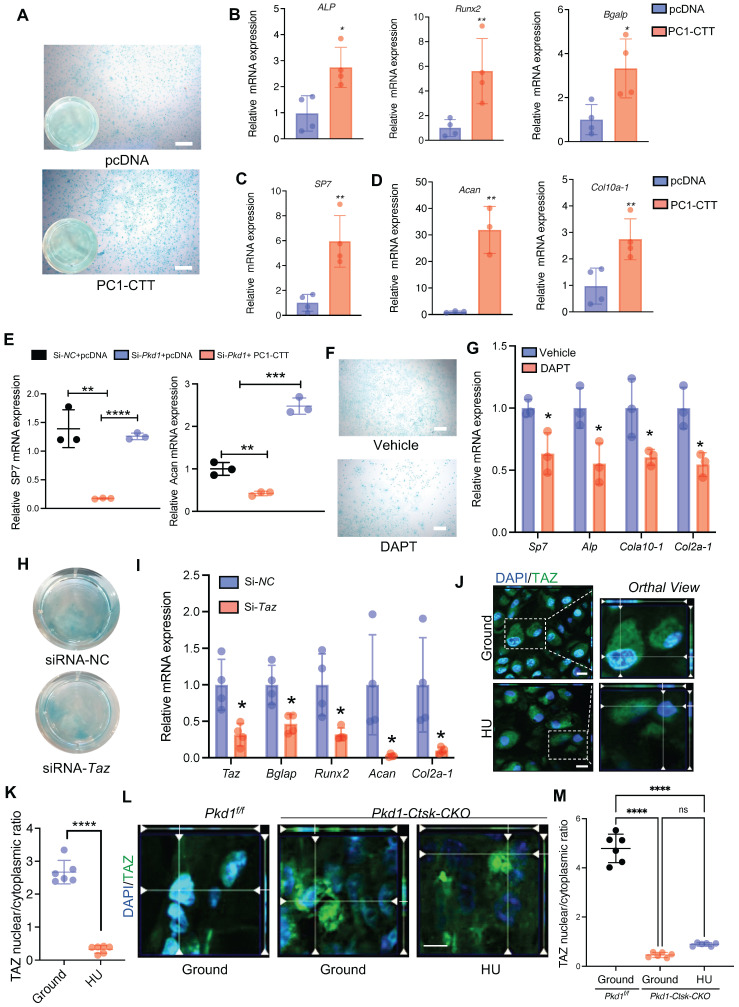
Figure 5.
PC1 regulates osteochondral differentiation potential of PSPCs via its C-terminal tail and downstream TAZ. A Representative image of Alcian blue staining of PSPCs followed by chondrocyte differentiation induction with transfection of control or PC1-CTT plasmids. Scale bar indicates 100 μm. B-D qPCR analysis of osteogenic-related genes expression (B, C) and chondrogenic-related genes expression (D) in PSPCs transfected with control or PC1-CTT plasmids (n = 3-4). E qPCR analysis of Sp7 and Acan in the indicated groups (n = 3). F Alcian blue staining of PSPCs followed by chondrocyte differentiation induction with 10uM DAPT or vehicle treatment. Scale bar indicates 100 μm. G qPCR analysis of Sp7, Alp, Col10 a -1 and Col2a-1 in the 10uM DAPT or vehicle treated groups (n = 3). H Alcian blue staining of PSPCs followed by chondrocyte differentiation induction with siRNA-Taz or siRNA-NC transfected. I qPCR analysis of Taz, Bglap, Runx2, Acan-1 and Col2a-1 of the PSPCs transfected with siRNA-Taz or siRNA-NC (n = 4). J, K Representative immunofluorescence staining images of TAZ (green) in PSPCs isolated from fracture femora in the ground and the HU treated group. Nuclei, DAPI (blue). Dotted squares indicate magnified areas. Scale bar indicates 10 μm. L Representative immunofluorescence staining images of TAZ (green) in PSPCs isolated from Pkd1 fl/fl mice and Pkd1-Ctsk-CKO mice femora. Nuclei, DAPI (blue). Scale bar indicates 5 μm. Data are presented as means ± SD. Unpaired t test. *p < 0.05, **p < 0.01, ***p < 0.001 and **** p < 0.0001.

