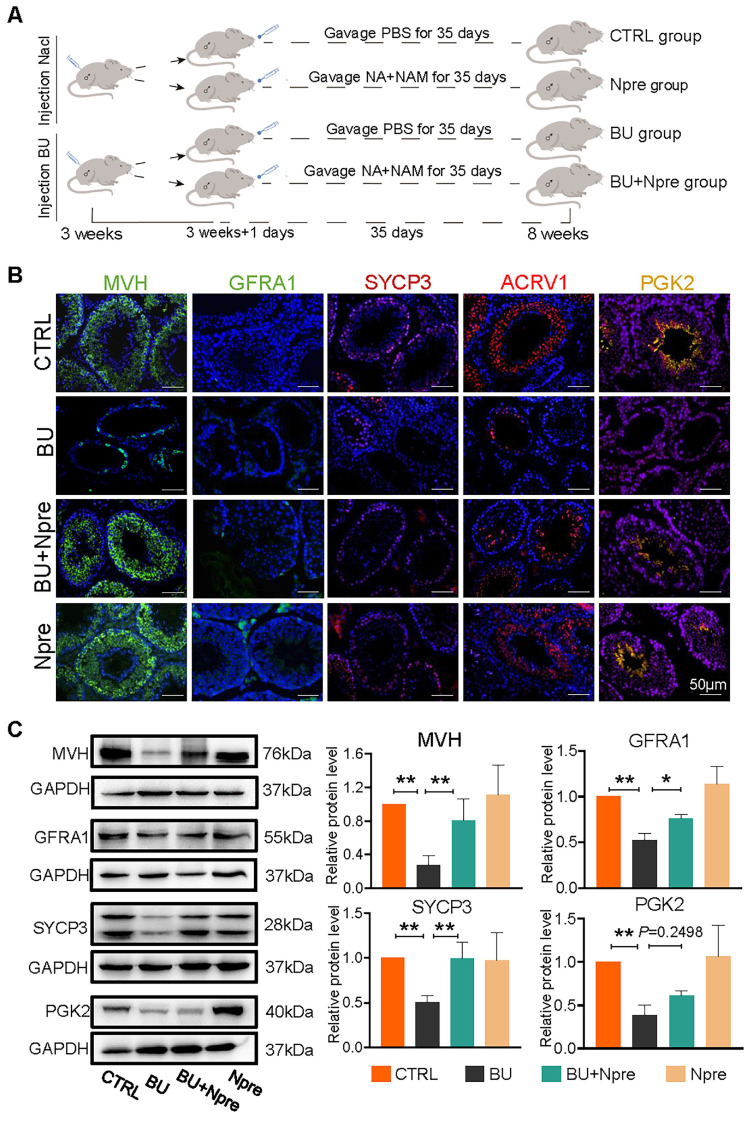
Figure 1.
Npre improves spermatogenesis in BU-treated mice. Experimental design diagram. (B) Representative IF images for MVH (germ cells), GFRA1 (SSCs), SYCP3 (SPCs), ACRV1 and PGK2 (spermatozoa) in tissue sections of seminiferous tubules of testes of the indicated groups; The nucleus was stained with Hoechst 33342. Scale bar=50 μm. (C) Left, representative WB images of MVH, GFRA1, SYCP3 and PGK2 of protein extracts from testes of the same mice groups in B; right, quantification of the protein levels of the same protein of B relative to GAPDH used as control. Testis samples were taken from at least 3 to 6 mice in each group and data from at least three independent replicates are showed as mean ± SD (*P < 0.05; **P < 0.01, ns=not significant).

