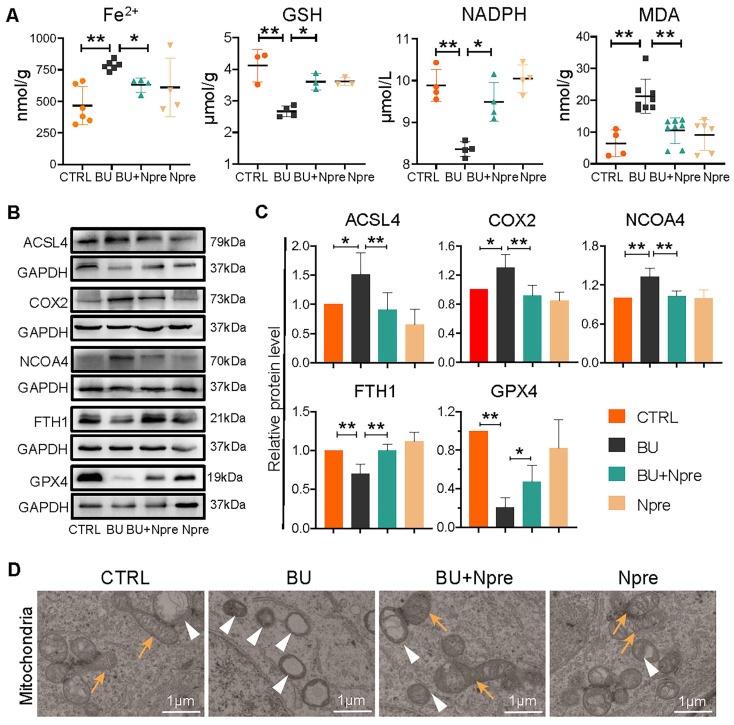
Figure 6.
Effect of BU and Npre on testis ferroptosis. (A) Concentrations of ferroptosis biomarkers in testes from the indicated groups. (B) Representative protein bands of ferroptosis biomarkers in testes from the indicated groups and their quantification relative to GAPDH. Each biological repeat came from at least three to five male mice. (D) TEM images of mitochondrial morphologies in each group. Note, in CTRL and Npre group, most of the mitochondria are intact ellipse with many inner cristae, in BU group, mitochondria become shrunken and were almost devoid of cristae. Arrows, normal mitochondria; arrowheads, abnormal mitochondria. Scale bar = 1 μm. The results include three independent replicates and are showed as mean ± SD (*P < 0.05; **P < 0.01).

