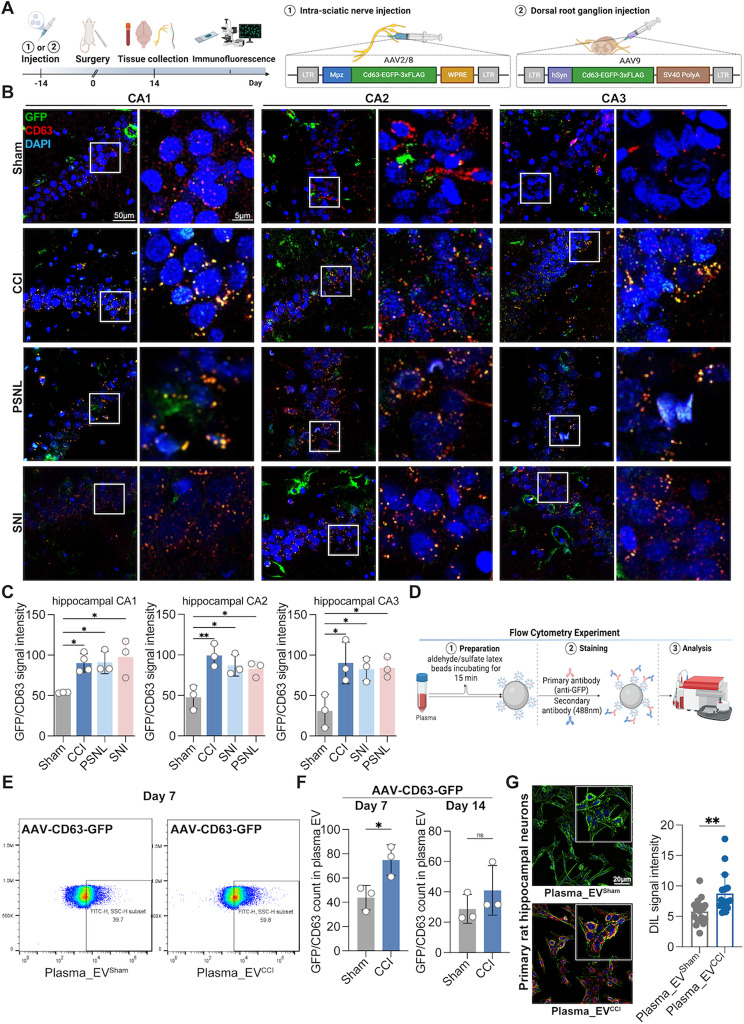
Fig. 2.
Tracing of specifically labeled Schwann cell-derived EVs in the hippocampus and plasma. (A) AAV design, construction, and flowchart for AAV injection. (B, C) Compared to those in the sham group, GFP-CD63 signal intensity (Meaning Schwann cells secreting GFP-CD63-specific labeled EVs) were significantly clustered in the hippocampal CA, CA2 and CA3 regions of CNP model rats with memory impairment, including the CCI, PSNL and SNI models. n = 3–4 rats. ordinary one-way followed by Dunnett’s multiple comparisons test was used. (D) Protocol for microbead-assisted flow cytometry. (E, F) Microbead-assisted flow cytometry revealed that the GFP/CD63 labeled-cell ratio in the plasma EVs of CCI rats was greater than that in those of sham rats on day 7 after modeling. There was no change in the GFP/CD63 ratio between the two groups on day 14 postmodeling. n = 3 rats. unpaired Student’s t test was used. (G) Images of primary rat hippocampal neurons co-incubated with sham or CCI rat plasma EVs after labeling with DIL revealed increased plasma_EVCCI within the neurons. n = 3–4 images from three wells of each group. unpaired Student’s t test was used. The data are shown as the means ± SDs. ns, no significant difference; *P < 0.05; **P < 0.01

