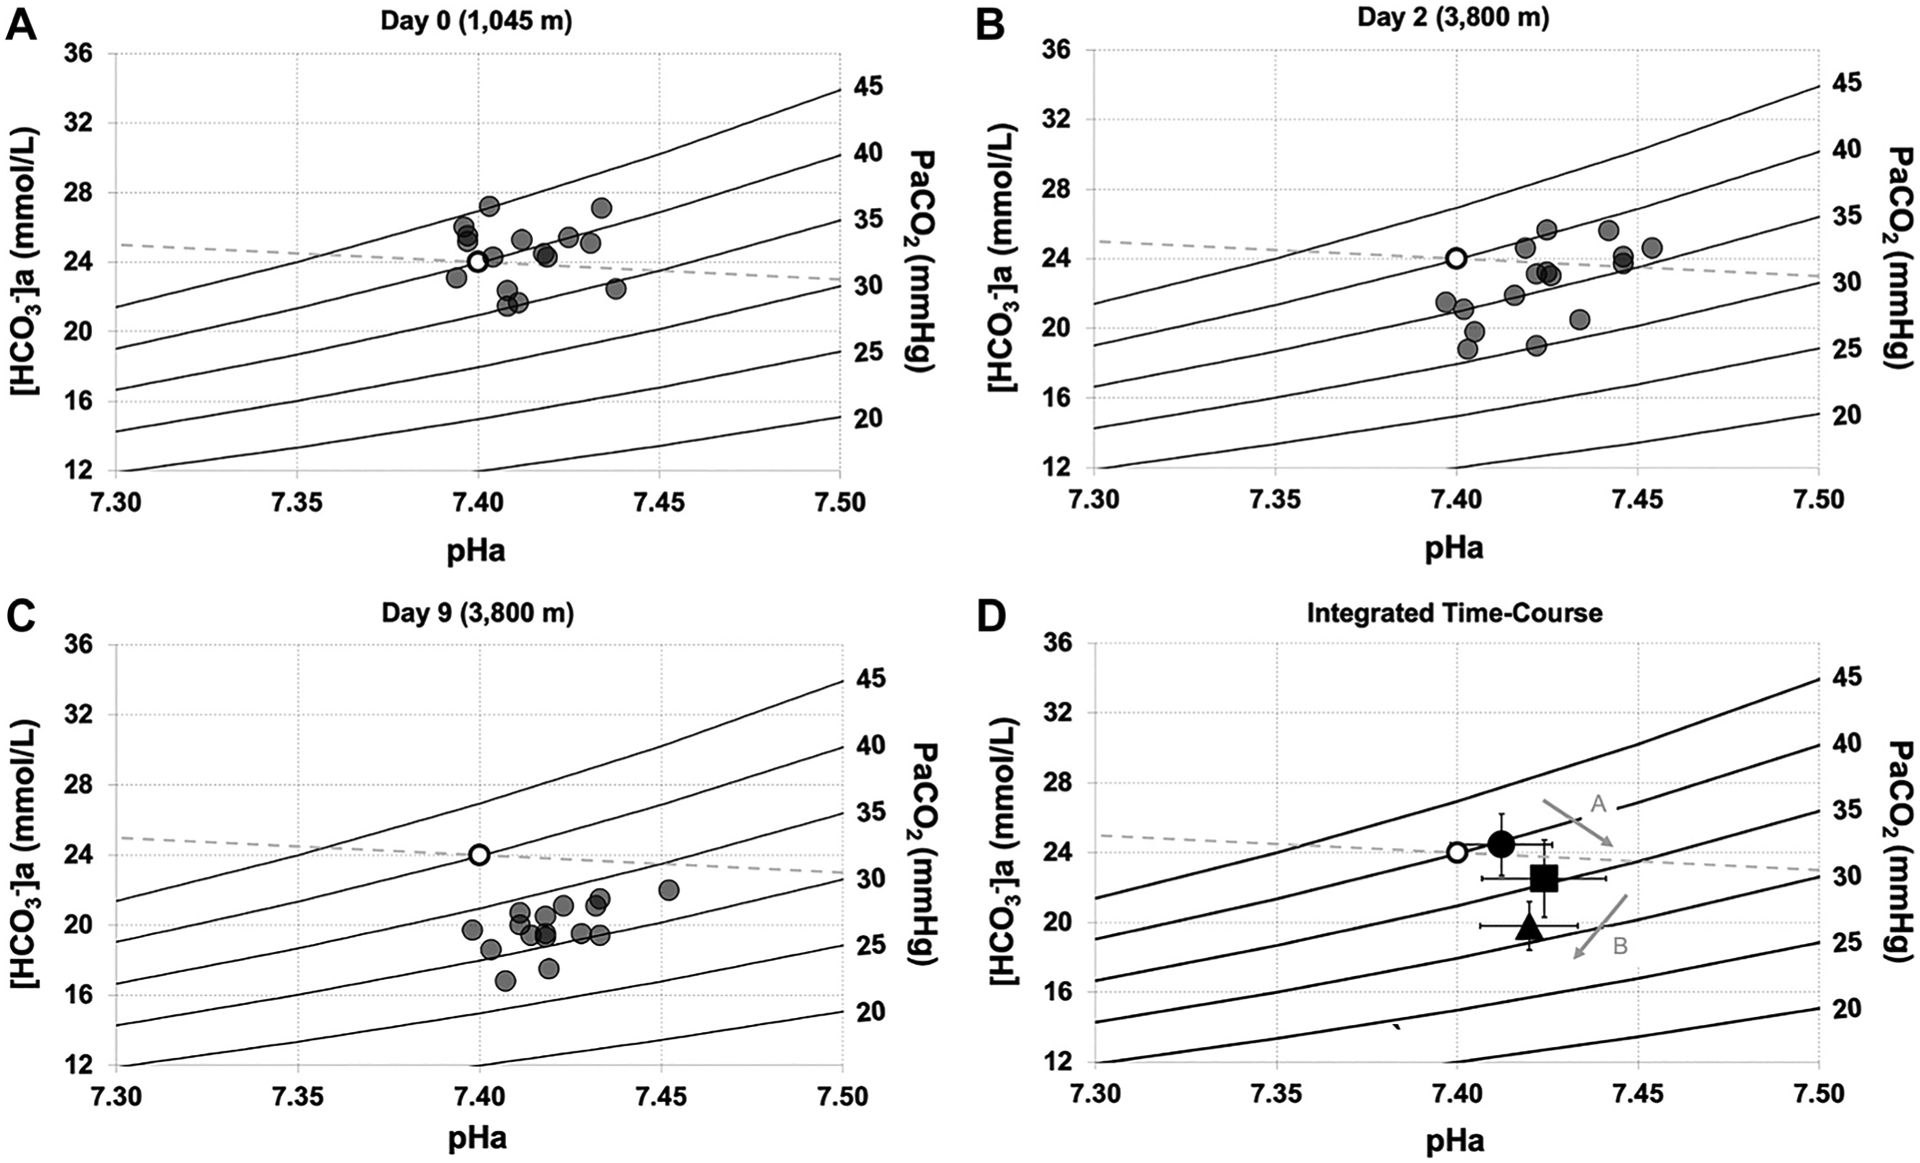
Figure 4.

Davenport diagrams during rapid ascent to and residence at 3,800 m. Individual data demonstrating relationships between , , and pHa at 1,045 m on day 0 (A), 3,800 m on day 2 (B; within 24 h of arrival by rapid ascent), and 3,800 m on day 9 (C). D: mean data demonstrating dynamic relationship of stimulus-response relationships between acid-base variables and time at 3,800 m. Open circle represents reference value. For A, B, and C, filled circles represent individual data. For D, filled circle represents 1,045 m (day 0), filled square represents 3,800 m (day 2), filled triangle represents 3,800 m (day 9), and arrows denote the group directional changes over time. Error bars represent standard deviation. n = 16. , arterial bicarbonate concentration; , partial pressure of arterial carbon dioxide; pHa, arterial pH.
