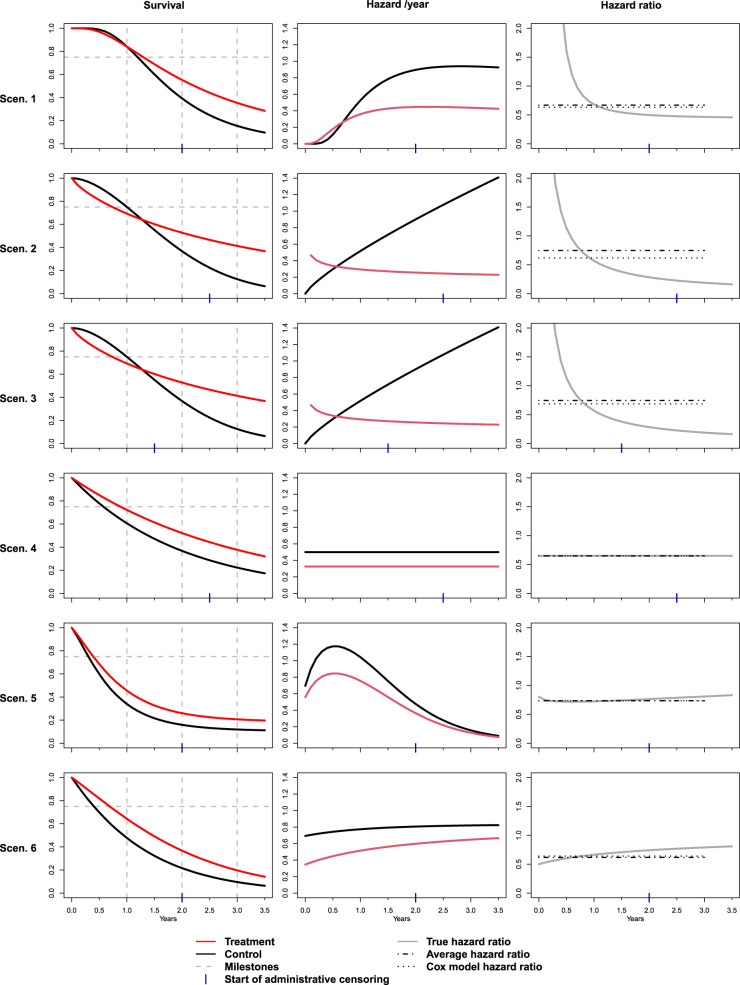
Figure 1.
Simulation scenarios. Left column: True survival functions for treatment and control group. Vertical dashed lines indicate the 1-, 2- and 3-year time point. The horizontal line indicates the 25% quantile. Middle column: True hazard rates (per year) as a function of time for treatment and control group. Right column: Hazard ratio between treatment and control as a function of time. Dotted and dash-dotted lines indicate the large sample limit of the Cox model hazard ratio estimate and the true average hazard ratio as defined in Section 2.2, both calculated with a cut-off at 3 years.

