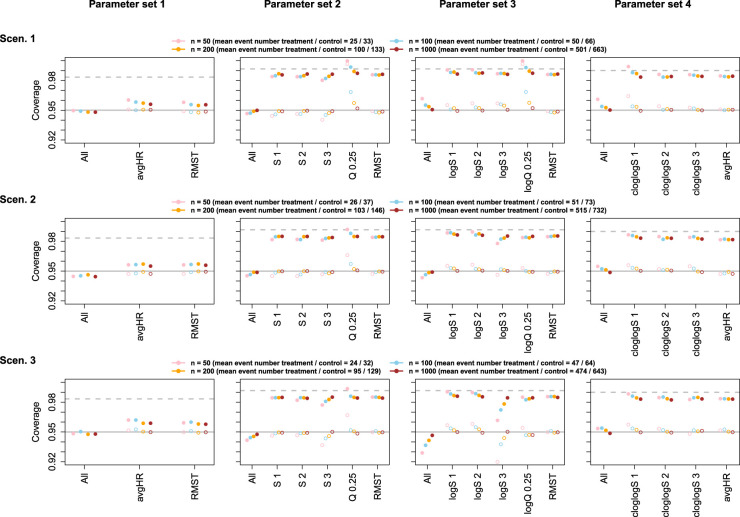
Figure 2.
Empirical coverage of confidence intervals for scenarios 1–3, based on the multivariate normal distribution with asymptotic covariance matrix estimate. Filled circles show the simultaneous coverage (All) and univariate coverage probability of multiplicity-adjusted intervals for single parameters (abbreviations as in Table 2). Open circles represent the coverage of unadjusted univariate confidence intervals. Error bars represent 95% Wald confidence intervals for the respective coverage probabilities. For comparison, the horizontal solid line indicates the nominal coverage of 95%, and the horizontal dashed line indicates the univariate confidence level that would result from a Bonferroni adjustment for the respective number of parameters. S 1: scenario 1; S 2: scenario 2; S 3: scenario 3; avgHR: average hazard ratio; RMST: restricted mean survival time; logS 1; log scenario 1; logS 2; log scenario 2; logS 3; log scenario 3; cloglogS 1: complementary log–log scenario 1; cloglogS 2: complementary log–log scenario 2; cloglogS 3: complementary log–log scenario 3.

