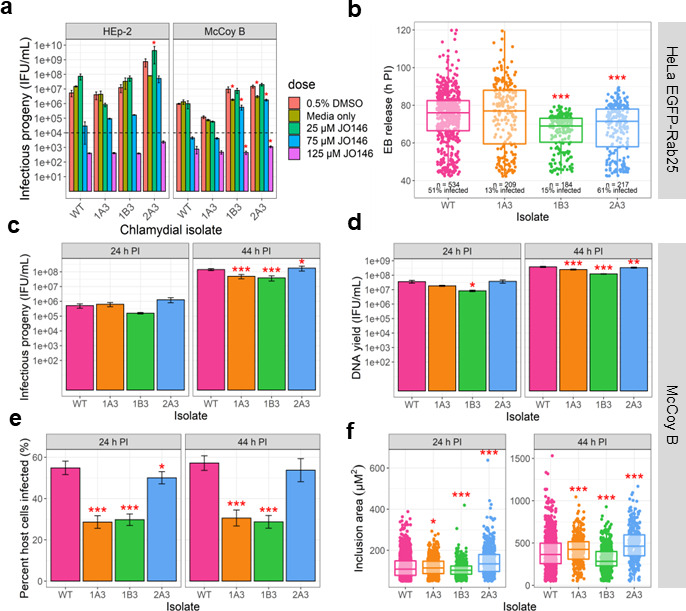
Fig 1.

Analysis of phenotypes of variants isolated with reduced susceptibility to JO146. (a) Recovery of infectious progeny following JO146 treatment of chlamydial variants cultured in HEp-2 and McCoy B cell lines that were treated at 16 h post-infection (PI) with JO146 doses and harvested at 44 h PI, prior to re-infection to determine inclusion forming unit (IFU)/milliliter yields indicated in this figure. Error bars represent the standard error of the mean (SEM) of three independent experiments (n = 3). The dashed line indicates the threshold of accuracy (1 × 10⁴ IFU/mL) for this enumeration method. *P < 0.05 compared to dimethylsulfoxide (DMSO) control as measured by two-way ANOVA with Dunnett’s multiple comparisons test. The % reductions for each isolate at 75 µM JO146 treatment relative to the solvent are HEp-2: WT: 99.46%, 1A3: 97.73%, 1B3: 98.68%, and 2A3: 92.87% and McCoy B: WT: 99.53%, 1A3: 94.39%, 1B3: 94.23%, and 2A3: 88.31%. (b) EB release from cells for each isolate. Real-time microscopy analysis of EB release from HeLa EGFP-Rab25 host cells is shown in hours post-infection (h PI) (y-axis) and variants (x-axis). The number of inclusions monitored and % infectivity are indicated under the data set for each variant. The microscopy was conducted from 42 to 120 h PI with data collected every 30 min; every visible inclusion in each field of view was monitored until no longer visible in the cell or the cell was also no longer visible, and this was recorded as the exit point. (c) Infectious progeny yields of isolates at 24 and 44 h PI. Three biological replicates were enumerated in duplicate for each isolate at each timepoint. (d) Yield of chromosomal DNA at 24 and 44 h PI, determined by quantitative polymerase chain reaction (qPCR). Three biological replicates were quantified in duplicate for each isolate at each timepoint. (e) The percent of McCoy B host cells infected by each isolate at 24 and 44 h PI. (f) Inclusion vacuole size at 24 and 44 h PI. The inclusion vacuole size was measured as a two-dimensional area (µM2). Triplicates of each isolate at each timepoint were visualized by microscopy with multiple fields of view or samples analyzed. Error bars represent SEM from multiple experiments. *P-value ≤0.05, **P-value ≤0.001, and ***P-value ≤0.0001, as measured by Student’s t-test with Holm–Sidak’s test for multiple comparisons.
