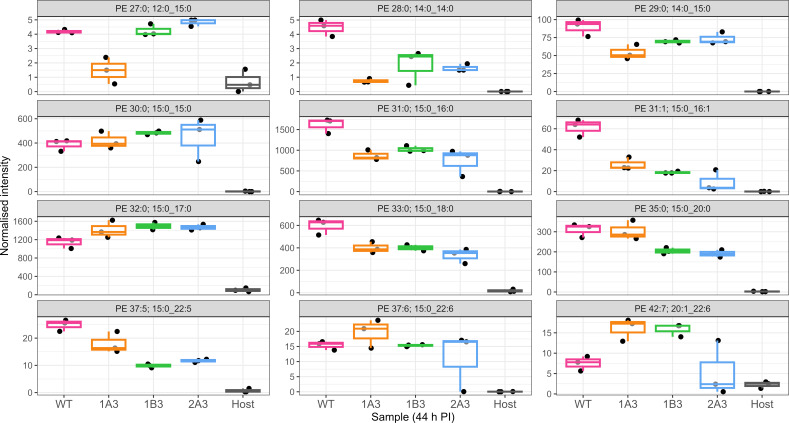
Fig 4.
Normalized intensities of PE lipids at 44 h PI in WT, variants, and host cells. The data are presented as box plots, color-coded for each strain indicated on the x-axis of each box. The normalized intensities are indicated on the y-axis. Different normalized intensities are used to more clearly show differences, as differences in low abundant lipids may still be biologically significant. Significance was measured by one-way ANOVA, performed using MetaboAnalyst as described in Materials and Methods. Each species is indicated in the gray bar at the top; WT, variants, and host cell only are indicated on the x-axis. An asterisk indicates a significant difference (P < 0.05) in normalized intensity compared to WT (n = 3 each). The best match/assignment across the samples is identified in the graph.

