
Fig. 2.
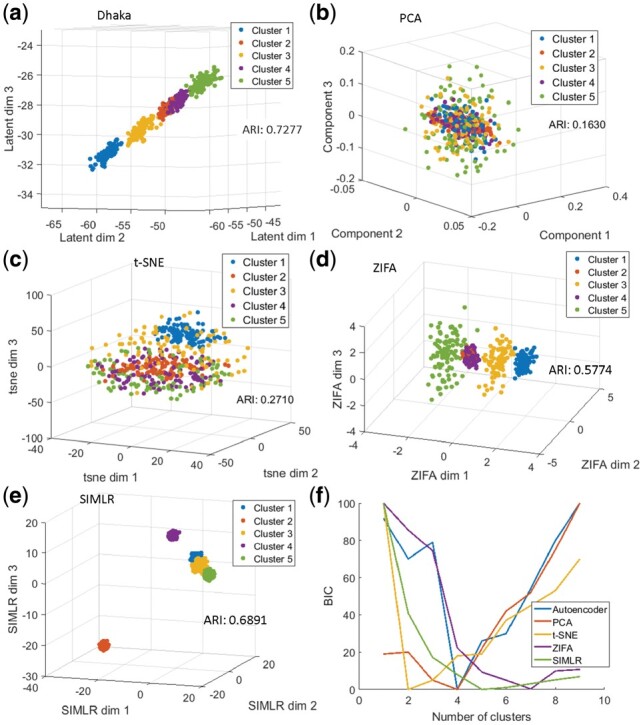
Comparison of the Dhaka method with t-SNE, PCA, ZIFA and SIMLR on simulated dataset with 2500 completely noisy genes (83% of total genes) without any cluster specific expression. (a) Dhaka, (b) PCA, (c) t-SNE, (d) ZIFA, (e) SIMLR. The colors correspond to the ground truth cluster ids. (f) Plot of BIC calculated from fitting Gaussian Mixture Model to the 3D projection of the data to estimate number of clusters. The number with lowest BIC is considered as the estimated number of clusters