
Fig. 4.
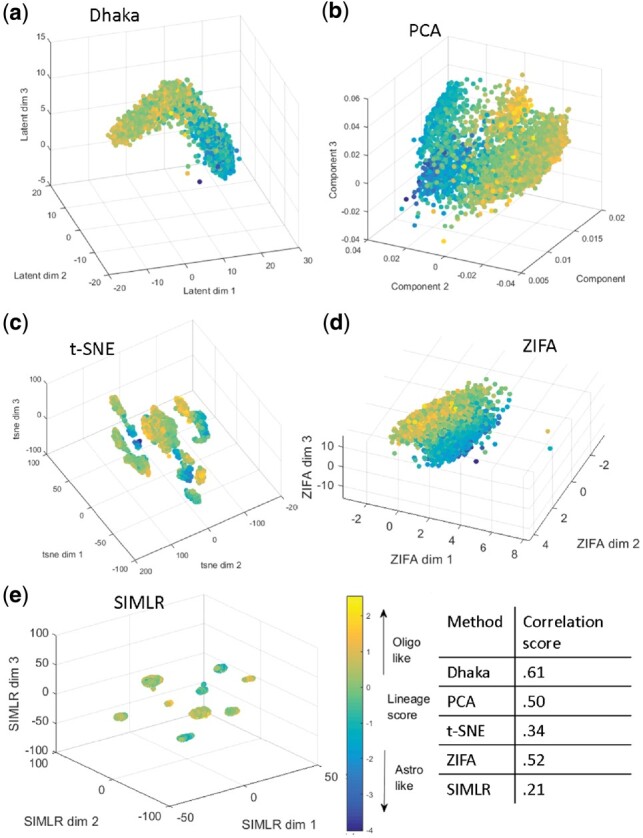
Comparison of Dhaka with PCA, t-SNE, ZIFA and SIMLR on Oligodendroglioma dataset with 5000 auto-selected genes. (a) Dhaka, (b) PCA, (c) t-SNE, (d) ZIFA, (e) SIMLR projections colored by lineage score. The Spearman rank correlation scores of the scoring metric (lineage and differentiation score) and the learned projections are shown in tabular form. We can see that Dhaka preserves the original scoring metric the best