
Fig. 9.
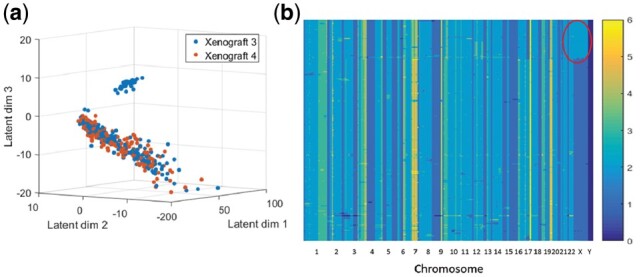
Dhaka output of two xenograft breast tumor samples’ copy number profile. (a) Identification of two subpopulations of cells in xenograft 3 and one subpopulation in xenograft 4. (b) Copy number profile of cells in xenograft 3 ordered by phylogenetic analysis, which shows that there are indeed two groups of cells present in the data (minor cluster having two copies of X chromosome marked by red circle). The colors correspond to the number of copies in each genomic bin count