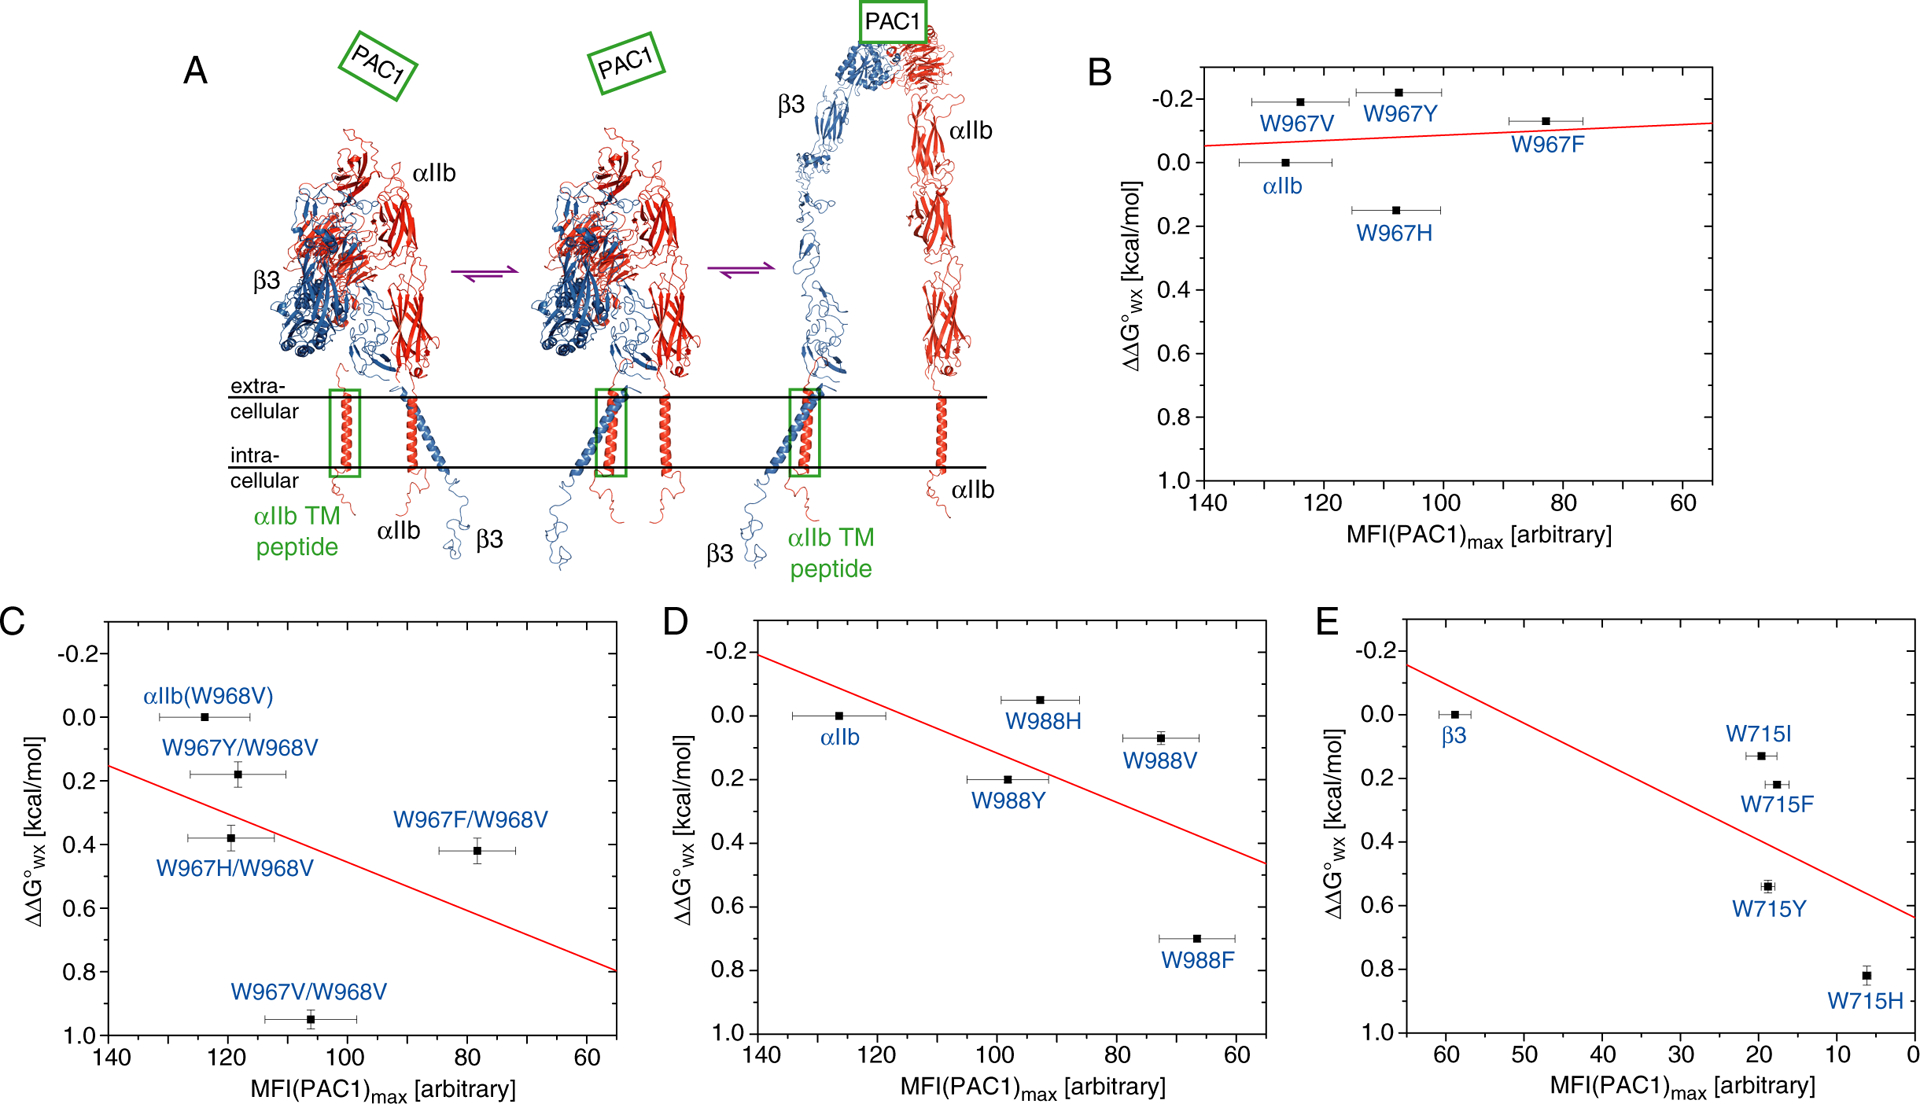
Figure 6.

Correlation of αIIbβ3 TM complex stabilities in phospholipid bicelles and mammalian membranes. (A) Displacement assay employed to measure relative TM complex stabilities in membrane. Increasing amount of overexpressed integrin TM peptide, boxed in green, displaces its corresponding TM segment in the native receptor, leading to integrin activation as monitored by the binding of the ligand-mimetic antibody PAC138 (Figure S4). (B-E) For the depicted substitutions, the level of maximal receptor activation, MFI(PAC1max), obtained at saturating concentration of overexpressed TM peptide is correlated with the change of TM complex stability in bicelles, ΔΔG°WX (Figure 4 and Table 2). Linear fits are shown in red mainly to illustrate the absence of any strong correlation.
