

Abstract
Ample evidence documents the association between individual-level risk factors and mental health status; relatively less is known about associations between features of the context in which individuals live and their mental health. The objective of this study is to assess differences in associations between contextual characteristics of both rural and urban settings and mental health status measured by the mental health component of the SF-12. Using state-representative data, we observed significant rural/urban differences in the association of mental health status with availability of health care resources but no significant associations in other contextual domains. Lack of overlap in contextual associations suggests that contextual influence operates differently in rural and urban settings and that interventions to improve mental health may not translate across settings.
Keywords: mental health, rural health, urban health, multi-level modeling
Introduction
The burden of mental illness in the United States is high as mental disorders are a leading cause of disability (The World Health Organization, 2004) with approximately one in four adults suffering from a diagnosable mental disorder each year (Kessler et al., 2005). The potential influence of individual characteristics on mental health status is well recognized (Weich et al., 2001b, 2004; Weich and Lewis, 1998; Lorant et al., 2003). Previous work, for example, documents associations between lower income and a higher incidence of anxiety and depression, potentially mediated by other psychiatric risk factors including inferior coping styles and weaker social support among the poor (Turner and Lloyd, 1999).
Comparatively less is known about how people’s surroundings, or the context in which they live, affects their mental health despite increasing evidence that such effects exist (Muramatsu, 2003; Weich et al., 2001a, 2003; Yen and Kaplan, 1999). This body of work proposes several pathways through which context may affect mental health status including physiological mechanisms resulting from chronic exposure to stress and adaptations to stress (McEwen, 1998; Ross, 2000). Some have suggested, for example, that individual differences in perceived stress (Aneshensel and Sucoff, 1996) and the behavioral and physiological responses to stress result in chronic stimulation of multiple allostatic systems including the autonomic nervous system, the hypothalamic–pituitary–adrenal axis, and the cardiovascular, metabolic, and immune systems. While allostatic systems normally protect the body (McEwen, 1998), greater allostatic load associated with residence in locations characterized by pervasive social disorder (Ross, 2000; Aneshensel and Sucoff, 1996) or concern for personal safety (Aneshensel and Sucoff, 1996; Ewart and Suchday, 2002) may contribute to neuro-hormonal imbalances associated with depression (Pariante and Miller, 2001). Living in areas of economic disadvantage, characterized by high poverty and unemployment, may also cause chronic stress (Ross, 2000). Importantly, these contextual “exposures” are associated with higher morbidity for all residents regardless of their personal resources or health enabling characteristics (Boyle et al., 2004).
Despite recognized differences between rural and urban areas in both context and composition (Ricketts et al., 1999), much of what we know about associations between context and mental health status is derived from research conducted in urban settings (Mitchell and LaGory, 2002; Aneshensel and Sucoff, 1996; Curtis, 2007). Whether these associations are relevant in rural settings remains unknown, and yet this information may be useful in informing strategies to reduce the burden resulting from differing mental health care needs of rural populations (Philo et al., 2003; Judd et al., 2002). Therefore, the objectives of this study are (1) to determine the extent to which contextual factors are related to mental health status in rural and urban settings and (2) to compare these patterns of association.
Conceptual Model
Our conceptual framework (Fig. 1) blends aspects of other models and proposes two levels of influence populated by several elements reflecting the contribution of both individual and contextual characteristics to mental health status (Andersen, 1995; Judd et al., 2002). Components of the first level are drawn from the Andersen Behavioral Model of Health Care Utilization (Andersen and Newman, 1973). The Andersen model was developed to both predict and explain influences on access to and utilization of health care services, but subsequent revisions extended the model to evaluate health status as an outcome of either potential or actual access (Andersen, 1995). Within the Andersen framework, individual-level characteristics are grouped into those that predispose one to seek health care services, that enable the individual to access health care services, that represent the need for health care (either subjective or objective), that reflect personal health behaviors, and the utilization of health care services. Others have recognized a direct contribution of individual characteristics to mental health status independent of the utilization of health care services (Andersen, 1995; Judd et al., 2002); accordingly, these attributes are incorporated into our model as control variables.
Figure 1 -. Conceptual Model of Effects of Contextual and Individual Level Characteristics on Self-Reported Mental Health Status.
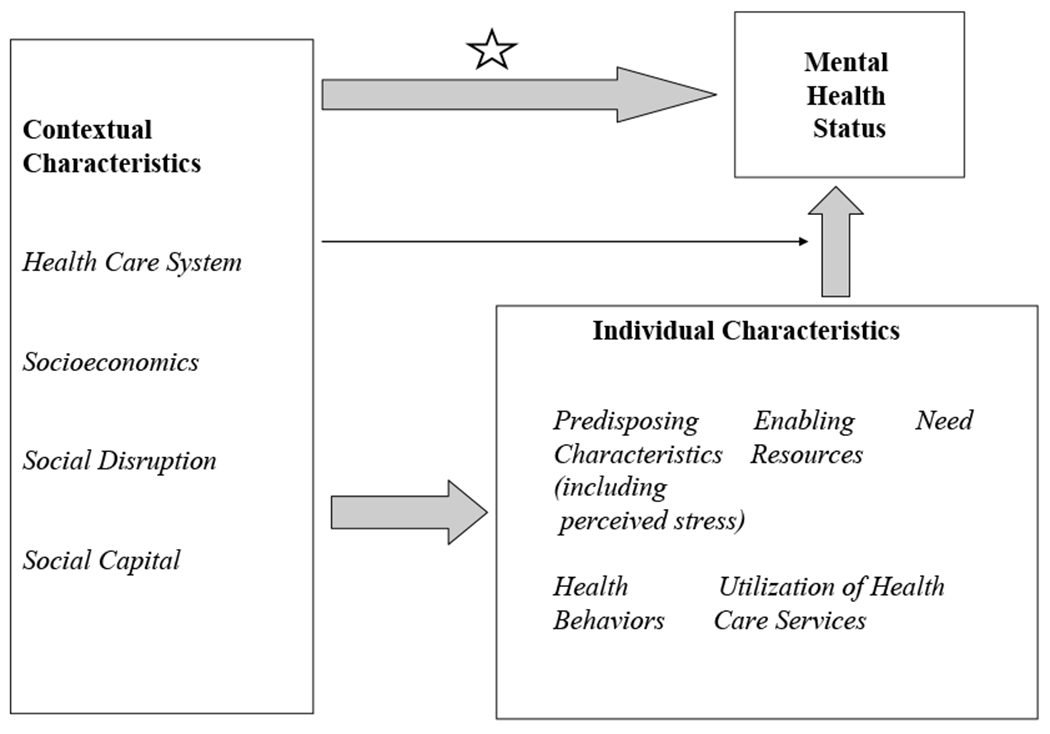
Each box identifies domains potentially exerting effects on mental health status. Domain names are in bold while sub-domains appear in italics. Block arrows represent direct additive effects between domains while thin arrow represents interactive effects between contextual and individual characteristics. The star indicates the pathway of main interest in this study.
A second level contains characteristics of the context in which the individual lives. Our model acknowledges four domains of particular importance. First, the structure and availability of health care resources reflect the level of access to services through which mental health issues may be resolved (Judd et al., 2002). Second, local economic conditions, known to be associated with the utilization of mental health care services (Curtis et al., 2006; Drukker et al., 2004; Tello et al., 2005) and the prevalence of mental health disorders (Muramatsu, 2003; Ross, 2000; Weich et al., 2001a, 2003; Wainwright and Surtees, 2004) are also included. Previous work, for example, supports the importance of this domain by suggesting that residents of lower socioeconomic (SES) areas experience greater morbidity regardless of their individual characteristics (Boyle et al., 2004). Third, social disruption (also referred to by some as social fragmentation and social isolation) represents a pathway through which alteration or breakdown of social life contributes to chronic stress and worry (Almog et al., 2004). Others have proposed that social disruption and population health, which includes mental health, share common contextual origins (Kawachi et al., 1999). We include a fourth domain, social capital, representing interpersonal trust, norms of reciprocity, and civic engagement, as a contextual characteristic that potentially buffers deleterious effects of context on mental health status (Almedom, 2005; De Silva et al., 2005; Hendryx et al., 2002; Kennedy et al., 1998; Mitchell and LaGory, 2002).While contextual effects may be mediated through individual characteristics, in this study, we explore the presence and magnitude of direct associations between contextual factors and mental health status that remain after controlling for the attributes of the individual. Identifying such direct associations may strengthen the case for developing and implementing policies that address fundamental economic or social factors that affect health (Link and Phelan, 1995). Of primary interest is variation in these associations among residents of rural and urban areas, given that each setting comprised differing constellations of contextual attributes independent of their composition (Ricketts et al., 1999). Interactions across levels, referred to as “cross-level interactions” (shown in Fig. 1 by a thin arrow), may be present between characteristics of individuals and their context and have been included to explore whether important associations arise only under specific circumstances.
Methods
Data Sources
All individual data were obtained from the 1998 Ohio Family Health Survey (OFHS), a cross-sectional household survey conducted in Ohio by the Gallup Organization for the Ohio Department of Health to examine patterns of health insurance coverage, health care access, and health status. Every Ohio county was sampled with approximately 60 individuals selected from rural counties and 400 individuals from urban counties. Use of survey weights and over-sampling by race and gender contributed to a sample that was representative of the state. A detailed report of survey development, sampling methods, data collection procedures, and quality control is available from the Ohio Department of Health (ODH, 1999).
Contextual-level data were derived from multiple sources. The 1998 Area Resource File provided county-level data on health care system characteristics and population estimates. The United States Census, the Bureau of Labor Statistics, and Federal Bureau of Investigation Uniform Crime Reports provided data on social capital, economic, and social disruption measures.
Dependent Variable
Following an approach used in previous studies (Kovess-Masfety et al., 2005; Wainwright and Surtees, 2004; Weeks et al., 2004; Hopman et al., 2002), the mental component summary (MCS) score of the Short Form 12 (SF-12) provided a generic measure of mental health status with well established psychometric properties (Ware et al., 1996, 2002). Generic measures such as the MCS have advantages over disease-specific measures, especially in studies that examine mental health functioning within a population. Norm-based scoring in particular makes the MCS readily interpretable; scores are standardized to a mean of 50 and standard deviation of 10, with lower scores denoting increasing levels of disability. Additionally, the MCS accurately measures mental health status in those unaffected by mental health disorders as well as among those with a wide range of diagnoses (Sanderson and Andrews, 2002).
Contextual-level Variables
Measures reflecting the structure and capacity of health care resources, which may help individuals resolve mental health issues, included the availability of primary care physicians (PCPs) per 10,000 county residents, an important source of mental health care particularly in rural areas, psychiatrists per 10,000, inpatient psychiatric beds per 10,000, and the presence (yes/no) of hospital-based psychiatric or social work services in the county. Indicators of local economic conditions included the proportion of county residents living in poverty, the proportion unemployed, median household income, the proportion of adults aged 25 or older with a high school degree or equivalent, and income inequality as measured by the Gini coefficient (Kawachi and Kennedy, 1999). We represented social disruption through the numbers of violent crimes per 10,000 residents, the proportion female-headed households, and the proportion vacant housing units. While others have created “deprivation indices” that combine information from several measures of economic conditions and social disruption (Almog et al., 2004; Curtis et al., 2006; Driessen et al., 1998; Drukker et al., 2004; Tello et al., 2005), we chose an approach that allowed us to uncover associations between each contextual feature and mental health. To operationalize the social capital domain, we used two components from Putnam’s Comprehensive Social Capital Index (Putnam, 2000). “Community Organizational Life”, for example, is represented by the sum of the numbers of religious, grant-making, civic, and professional organizations per 10,000 residents. “Engagement in Public Affairs” is captured by the proportion of adults voting in the 1996 Presidential election, an indicator of social capital used in previous studies of health and health care access (Hendryx et al., 2002; Lindstrom et al., 2003). Finally, rural/urban status was determined using designations from the 1993 Rural Urban Continuum Codes that distinguish metropolitan (categories 0-3) from non-metropolitan (categories 4-9) counties (ERS, 2007).
Individual-level Variables
The individual-level measures in our conceptual model encompass characteristics previously linked to mental health status. Predisposing factors consist of age, gender, educational attainment, and race/ethnicity. Given the limited number of survey participants reporting race/ethnicity other than Caucasian, African-American, or Hispanic, we created a category indicating race other than Caucasian or Hispanic ethnicity. Enabling factors include continuous lack of health insurance in the previous year, adjusted household income below 200% of the federal poverty level, absence of a usual source of medical care, lack of social support denoted by absence of a partnered relationship, and lack of paid employment outside the home. Factors generally associated with increased healthcare need include self-assessment of fair/poor general health status versus all other categories and the physical component summary (PCS) score from the SF-12. Additionally, measures of health behaviors linked to lower mental health status encompass lack of leisure time exercise in the past 30 days and current smoking status. However, due to the absence of specific data on mental health services utilization in the OFHS, we were unable to incorporate an operational indicator representing this aspect in our conceptual model.
Level of Geography
For all variables, the county served as our unit of geographic aggregation. While previous studies of contextual effects on health outcomes employed various levels of geography (Krieger et al., 2002, 2003; Litaker and Cebul, 2003; Litaker and Love, 2005; Driessen et al., 1998), we based our use of the county on central place theory. A key tenet of this economic theory is that the size, spacing, and function of population centers arise according to the provision of goods and services (Christaller, 1933). We reasoned that “exposures” to health care supply would generally be located outside census blocks or tracts and would thus be sought across larger geographic regions. Similarly, the influence of other contextual characteristics is potentially correlated with the economic viability of local governments that may determine the number and quality of services (health-related and non-healthcare-related) at larger geographic units than census tracts or blocks.
Analysis
The individual served as our unit of analysis, and all analyses were stratified by county-level rural/urban designation. Our analytical approach consisted of several steps. We first determined the distributions of contextual-level characteristics and the weighted distributions of individual-level characteristics. Next, we assessed weighted bivariate associations between all variables and survey participants’ MCS score. Given the structure of our data, we then used hierarchical/multilevel modeling to assess associations between contextual characteristics and the MCS score. This analytic approach is more appropriate than ordinary least-squares modeling because our unit of analysis is clustered within a higher-order unit (e.g., persons in counties). Such clustering reduces variation due to correlation among outcomes within the higher-order unit and violates the independence assumption of ordinary least-squares modeling (Raudenbush and Bryk, 2002). Additionally, contextual factors potentially associated with mental health status may have common origins (Link and Phelan, 1995), and multilevel models allow simultaneous examination of multiple factors, enabling a clearer understanding of their independent effects.
As mentioned, most prior work in this field has been carried out in urban environments, and generalizability to rural environments is unknown. To uncover potentially important insights in the setting of exploratory models, Harrell suggests relaxing model fit criteria and including all predictors as some become important only after adjusting for the effects of other variables (Harrell, 2001). Thus, we advanced all variables to multivariable models and used a “relaxed” p-value of 0.10 to indicate statistical significance in the final models to maximize opportunities for insight and future hypothesis testing.
After testing for collinearity and eliminating contextual variables with correlations above 0.70, we created our final rural and urban models in two steps: (1) a model including only contextual-level variables to measure their contribution to MCS score; and (2) a model adding individual-level variables to model 1 to assess for changes in contextual contributions controlling for individual-level characteristics. Finally, we performed analyses testing for cross-level interactions using variance point estimates, likelihood ratio tests, and reliability statistics (Raudenbush and Bryk, 2002). A priori, we assessed whether vulnerable individuals (e.g., those with low incomes or without health insurance) living in disadvantaged counties (e.g., high poverty) reported disproportionately lower mental health status. Further, we evaluated a previously reported interaction between race and urbanicity with psychological distress (Neff and Husaini, 1987). Because our main analyses were stratified by rural/urban status, we tested for a potential interaction between race/ethnicity and urbanicity/rurality in a separate model that used all survey data. We assessed the fit of nested models and interactions with deviance and R-squared statistics.
In supplemental analyses, we examined the external generalizability of our final models. To do this, we applied the derived coefficients from the primary analysis to calculate a “predicted” MCS score using a similar database from another state. We then compared this predicted score to the actual MCS score reported by participants in the second sample.
With an average unweighted sample size of 185 per county and an intra-class correlation coefficient of 0.02, we had power at the 0.80 level to detect an effect size of 0.097 (Optimal Designs Software, Version 0.30). HLM Version 6.0 (Lincolnwood, IL, USA), and Stata Version 7.0 (College Station, TX, USA) were used for all analyses. Institutional Review Board exemption was granted by Case Western Reserve University.
Results
The sample size consisted of 6311 individuals in 49 rural counties and 9950 individuals in 39 urban counties (total N=16,261). In comparing contextual characteristics (Table 1), residents of rural counties had access to fewer health care resources and lived in areas with less income, lower educational attainment, more female-headed households, higher unemployment rates, and more prevalent vacant housing. Rural residents were more likely than their urban counterparts to be white, older, and have less educational attainment but were more likely to be in a partnered relationship. Significant differences in mean MCS score did not exist between rural and urban areas.
Table 1 -.
Distribution of Contextual and Individual Characteristics by Urban and Rural Status
| Contextual Level | |||
|---|---|---|---|
|
| |||
| Rural (n=49) | Urban (n=39) | ||
|
| |||
| Health Care System Characteristics | Mean (SD) | p-value for ANOVA or Chi-Square | |
| Primary Care Physicians per 10,000 residents | 6.28 (2.06) | 7.99 (2.98) | 0.002 |
| Psychiatrists per 10,000 residents | 0.22 (0.28) | 0.55 (0.49) | < 0.001 |
| Psychiatric Beds per 10,000 residents | 0.74 (1.65) | 1.68 (1.65) | 0.009 |
| Hospital with Psychiatric Care, number (percent) | 10 (20.41) | 27 (69.23) | < 0.001 |
| Hospital with Social Work Services, number (percent) | 36 (73.47) | 35 (89.74) | 0.059 |
|
| |||
| Local Economic Conditions | |||
|
| |||
| Proportion Living in Poverty | 11.23 (4.27) | 9.94 (3.43) | 0.131 |
| Proportion Unemployed | 5.99 (2.48) | 4.36 (1.25) | < 0.001 |
| Median Household Income | 35,579 (5102) | 40,435 (6899) | < 0.001 |
| Gini Coefficient (Income Inequality) | 0.40 (0.03) | 0.42 (0.03) | 0.026 |
| Proportion of population >25 with a high school degree or equivalent | 71.18 (6.43) | 75.75 (4.46) | < 0.001 |
|
| |||
| Social Disruption | |||
|
| |||
| Violent Crimes per 10,000 residents | 7.00 (7.15) | 14.96 (14.61) | 0.001 |
| Proportion Female Headed Households | 9.08 (1.54) | 10.33 (2.08) | 0.002 |
| Proportion Vacant Housing Units | 8.99 (5.61) | 6.08 (2.38) | 0.003 |
|
| |||
| Social Capital | |||
|
| |||
| Proportion Voting in 1996 presidential election | 54.37 (5.06) | 54.97 (4.28) | 0.555 |
| Religious, Grant-making, Civic and Professional Organizations per 10,000 residents | 23.72 (38.87) | 19.59 (45.65) | 0.658 |
| Individual Level | |||
|
| |||
| Rural (n=6,311) | Urban (n=9,950) | ||
|
| |||
| Predisposing | Weighted Proportion | p-value | |
|
| |||
| Female gender | 52.06 | 52.88 | 0.527 |
| Age in years, mean (SD) | 47.54 (17.22) | 46.51 (16.56) | < 0.001 |
| Non-white race/ethnicity | 3.48 | 15.61 | < 0.001 |
| Does not have high school diploma | 65.93 | 54.22 | < 0.001 |
|
| |||
| Enabling | |||
|
| |||
| No current health insurance | 10.72 | 11.90 | 0.167 |
| Low family income (<200% of federal poverty level) | 17.54 | 18.18 | 0.526 |
| Not currently in a partnered relationship | 27.81 | 36.84 | < 0.001 |
| Not working for pay | 21.31 | 20.36 | 0.370 |
| Has no usual source of medical care | 16.57 | 18.35 | 0.082 |
|
| |||
| Need-related | |||
|
| |||
| Rates general health as fair/poor | 15.03 | 15.57 | 0.568 |
| SF-12 Physical Component Score, mean (SD) | 49.63 (10.51) | 50.17 (10.21) | 0.001 |
|
| |||
| Health Behaviors | |||
|
| |||
| Reports no leisure time exercise in previous 30 days | 31.73 | 29.75 | 0.095 |
| Current Smoker | 26.28 | 28.02 | 0.125 |
|
| |||
| Outcome | |||
|
| |||
| SF-12 Mental Component Score, mean (SD) | 52.31 (9.32) | 52.27 (9.01) | 0.807 |
After assessing collinearity among contextual variables, we excluded two contextual measures: median household income due to a high correlation with the proportion in poverty (r2 = −0.86) and psychiatric beds due to a high correlation with hospitals offering psychiatric services (r2 = 0.78). The per capita availability of psychiatrists and PCPs were collinear (r2 = 0.70) but were both retained as they offer complementary mental health care services, particularly in rural areas.
We observed contrasting patterns of bivariate associations at the contextual level between rural and urban settings (Table 2). For example, in rural areas, PCP availability was associated with an increase in the MCS score while the proportion in poverty and unemployed, the degree of income inequality, and the proportion of female-headed households were associated with decreases in an individual’s MCS score. None of these variables were associated with the MCS score in urban settings. In contrast, average educational attainment was associated in urban settings with an increase in MCS score while the presence of hospital-based psychiatric services was associated with a decrease in MCS score. Only the number of religious, grant-making, and civic and social organizations had a significant bivariate association with MCS score in both rural and urban models. At the individual level, patterns of association were comparable between rural and urban areas.
Table 2 –
Weighted Bivariate Associations of Contextual and Individual Variables by Urban and Rural Status with Mental Component Summary (MCS) Score
| Rural | Urban | |
|---|---|---|
|
| ||
| Contextual Level | Estimate (SE) | Estimate (SE) |
|
Health Care System Characteristics
| ||
| Per one additional Primary Care Physician per 10,000 residents | 0.276 (0.106)*** | 0.002 (0.081) |
| Per one additional Psychiatrist per 10,000 residents | −0.717 (1.10) | −0.095 (0.298) |
| Having Hospital with Psychiatric Care | −0.927 (0.785) | −1.319 (0.504)** |
| Having Hospital with Social Work Services | 0.088 (0.574) | −0.351 (0.993) |
|
| ||
| Local Economic Conditions | ||
|
| ||
| Proportion people living in poverty (per 1% increase) | −0.276 (0.054)*** | −0.141 (0.102) |
| Proportion people unemployed (per 1% increase) | −0.401 (0.126)*** | −0.010 (0.274) |
| Gini Coefficient (per one unit increase) | −0.302 (0.079)*** | −0.068 (0.072) |
| Proportion of population >25 with a high school degree or equivalent (per one unit increase) | 0.089 (0.062) | 0.130 (0.074)* |
|
| ||
| Social Disruption | ||
|
| ||
| Violent Crimes per 10,000 (per one unit increase) | −0.076 (0.046)* | −0.001 (0.017) |
| Proportion Female Headed Households (per 1% increase) | −0.689 (0.146)*** | −0.159 (0.129) |
| Proportion Vacant Housing Units (per 1% increase) | 0.025 (0.056) | −0.132 (0.135) |
|
| ||
| Social Capital | ||
|
| ||
| Proportion voting in 1996 presidential election (per 1% increase) | 0.094 (0.061) | 0.100 (0.068) |
| Per one additional Religious, Grant-making, Civic and Professional Organizations per 10,000 residents | 0.006 (0.003)* | 0.005 (0.002)*** |
|
| ||
| Individual Level | ||
|
| ||
| Predisposing | ||
|
| ||
| Female gender | −1.427 (0.374)*** | −1.822 (0.257)*** |
| Age in years | 0.058 (0.012)*** | 0.050 (0.009)*** |
| Non-white race/ethnicity | −0.281 (0.791) | −1.616 (0.427)*** |
| Does not have high school diploma | −0.279 (0.433) | −1.452 (0.240)*** |
|
| ||
| Enabling | ||
|
| ||
| Uninsured continuously last 12 months | −4.405 (0.776)*** | −5.276 (0.466)*** |
| Low family income (<200% of federal poverty level) | −4.668 (0.656)*** | −4.996 (0.484)*** |
| Not currently in a partnered relationship | −2.873 (0.411)*** | −1.950 (0.257)*** |
| Not working for pay | −3.907 (0.649)*** | −3.819 (0.399)*** |
| Has no usual source of medical care | −1.413 (0.506)*** | −1.592 (0.477)*** |
|
| ||
| Need-related | ||
|
| ||
| Rates general health as fair/poor | −7.217 (0.759)*** | −7.686 (0.422)*** |
| SF-12 Physical Component Score | 0.118 (0.023)*** | 0.120 (0.021)*** |
|
| ||
| Health Behaviors | ||
|
| ||
| Reports no leisure time exercise in previous 30 days | −2.463 (0.485)*** | −2.963 (0.351)*** |
| Smoker | −3.511 (0.543)*** | −3.432 (0.355)*** |
= p-value (0.1 - 0.05),
= p-value (0.05 - 0.01),
= p-value (<0.01); psychiatric beds per capita and median income were dropped due to collinearity.
Comparing stratified multivariable regression models found important differences between rural and urban settings (Table 3). For contextual measures of the health care system, we observed that only PCP availability (parameter estimate 0.175 [95% CI 0.076, 0.274]) had a significant association with MCS score in rural settings. That is, if two counties in our sample were compared in which the number of PCPs per 10,000 rural residents was 10 higher in one county, we would expect to observe an average MCS score 1.75 points higher in the county with more PCPs. In urban areas, two features of the health system were important. Psychiatrist availability (2.223 [0.873, 3.173]) and the presence of hospital-based psychiatric services (1.149 [1.650, 0.648]) had significant associations but in opposite directions. Among the variables reflecting socioeconomic status, only the proportion unemployed in urban settings (0.858 [0.467, 1.249]) was significantly associated with individuals’ MCS score. None of the measures of social capital or social disruption were significantly associated with MCS score in either rural or urban settings in multivariable models. At the individual level, patterns of association were comparable with one exception: in rural settings being of non-white race or Hispanic ethnicity was associated with a nearly two-point increase in MCS (1.880 [0.986, 2.774]). R-squared values for the final rural and urban models were 0.18 and 0.19, respectively, indicating that a large amount of variation in mental health status remained unexplained.
Table 3 -.
Comparison of Weighted Coefficients for Explanatory Model of Mental Health Status in Rural and Urban Ohio
| Rural | Urban | |||
|---|---|---|---|---|
|
| ||||
| Contextual Predictors (1) | Model 1 + Individual Predictors | Contextual Predictors (1) | Model 1 + Individual Predictors | |
|
| ||||
| Variable | Estimate (SE) | Estimate (SE) | Estimate (SE) | Estimate (SE) |
|
Contextual Level
| ||||
| Intercept | 57.280 (8.526)*** | 56.800 (7.821)*** | 49.220 (10.091)*** | 51.138 (9.138)*** |
| Health Care System Characteristics | ||||
| Per one additional Primary Care Physician per 10,000 | 0.160 (0.107) | 0.175 (0.099)* | −0.080 (0.116) | −0.028 (0.110) |
| Per one additional Psychiatrist per 10,000 | 0.788 (0.804) | 0.676 (0.797) | 2.309 (1.27)* | 2.023 (1.150)* |
| Having a Hospital with Psychiatric Care | −0.924 (0.656) | −0.669 (0.639) | −1.369 (0.579)** | −1.149 (0.501)** |
| Having Hospital with Social Work Services | 0.132 (0.558) | −0.045 (0.524) | 0.374 (0.741) | 0.455 (0.673) |
|
| ||||
| Local Economic Conditions | ||||
|
| ||||
| Proportion people living in poverty (per 1% increase) | −0.171 (0.218) | −0.189 (0.198) | −0.208 (0.178) | −0.214 (0.165) |
| Proportion people unemployed (per 1% increase) | −0.109 (0.169) | −0.135 (0.165) | 0.985 (0.417)** | 0.858 (0.391)** |
| Gini Coefficient (per one unit increase) | 0.005 (0.215) | 0.013 (0.197) | −0.010 (0.206) | −0.005 (0.188) |
| Proportion of population >25 with a high school degree or equivalent (per one unit increase) | −0.022 (0.046) | −0.033 (0.046) | 0.112 (0.092) | 0.0093 (0.087) |
|
| ||||
| Social Disruption | ||||
|
| ||||
| Violent Crimes per 10,000 (per one unit increase) | −0.036 (0.030) | −0.028 (0.029) | 0.022 (0.014) | 0.017 (0.013) |
| Proportion Female Headed Households (per 1% increase) | −0.234 (0.228) | −0.162 (0.214) | −0.428 (0.308) | −0.414 (0.280) |
| Proportion Vacant Housing Units (per 1% increase) | 0.040 (0.030) | 0.037 (0.028) | 0.004 (0.120) | 0.002 (0.108) |
|
| ||||
| Social Capital | ||||
|
| ||||
| Proportion voting in 1996 presidential election (per 1% increase) | 0.006 (0.059) | 0.016 (0.054) | −0.054 (0.088) | −0.071 (0.078) |
| Per one additional Religious, Grant-making, Civic and Professional Organizations per 10,000 residents | 0.001 (0.005) | −0.001 (0.005) | 0.005 (0.005) | 0.004 (0.004) |
|
| ||||
| Individual Level | ||||
|
| ||||
| Predisposing | ||||
|
| ||||
| Female gender | −1.152 (0.389)*** | −1.558 (0.256)*** | ||
| Age in years | 0.067 (0.010)*** | 0.050 (0.006)*** | ||
| Non-white race/ethnicity | 1.880 (0.894)** | −0.120 (0.214) | ||
| Does not have high school diploma | 0.698 (0.363)* | 0.349 (0.213) | ||
|
| ||||
| Enabling | ||||
|
| ||||
| Uninsured continuously last 12 months | −1.371 (0.654)** | −2.687 (0.479)*** | ||
| Low family income (<200% of federal poverty level) | −1.987 (0.686)*** | −2.212 (0.507)*** | ||
| Not currently in a partnered relationship | −1.568 (0.435)*** | −0.518 (0.282)* | ||
| Not working for pay | −2.325 (0.485)*** | −1.565 (0.406)*** | ||
| Has no usual source of medical care | −0.246 (0.558) | −0.306 (0.424) | ||
|
| ||||
| Need-related | ||||
|
| ||||
| Rates general health as fair/poor | −7.630 (0.972)*** | −8.656 (0.604)*** | ||
| SF-12 Physical Component Score | −0.064 (0.027)** | −0.111 (0.026)*** | ||
|
| ||||
| Health Behaviors | ||||
|
| ||||
| Reports no leisure time exercise in previous 30 days | −1.502 (0.424)*** | −1.806 (0.237)*** | ||
| Smoker | −2.327 (0.496)*** | −2.149 (0.331)*** | ||
= p-value (0.1 - 0.05),
= p-value (0.05 - 0.01),
= p-value (<0.01); psychiatric beds per capita and median income were dropped due to collinearity.
We found no evidence for cross-level interactions specified a priori or those evaluated in post hoc analyses. In supplemental analysis, we observed poor predictive validity in MCS score when coefficients from model 2 were applied to a comparable dataset on the health of respondents in another state.
Discussion
This study represents the first, to our knowledge, to delve into the distinct rural/urban impact of multiple specific contextual variables on mental health status using a large, state-representative sample. Our analyses unveil varying patterns of associations between measures of context and mental health status in rural and urban areas. Since no single contextual variable achieved statistical significance in both settings, our data suggest that policies or interventions formulated from research conducted in urban settings may not effectively translate to alleviate the burden of mental health disorders in rural areas.
The variation in the importance of associations between primary care and psychiatric care capacity with mental health status in rural and urban areas warrants particular attention. In rural areas, greater PCP availability was linked with better mental health, possibly reflecting the role of primary care as frontline providers of mental health treatment in these regions. In contrast, the absence of a similar association in urban areas and the presence of an association between greater psychiatrist availability and higher mental health status likely reflect the urban distribution of these health care providers. Although our study’s cross-sectional design doesnť allow for causal inferences, we found no significant differences in mean MCS scores across rural and urban settings, suggesting that the population-wide mental health burden might be more closely associated with absolute physician availability rather than the specialty training of physicians in diagnosing and managing mental health issues.
In examining associations between other contextual measures of health care resources, we found that the presence of hospital-based psychiatric services in rural areas was unrelated to mental health status, while an association with decreased mental health status in urban areas was observed. This finding may be partly due to confounding, as individuals with severe mental health disabilities may choose to live closer to such services. Despite modeling with several contextual characteristics commonly employed in mental health research, our analyses revealed relatively weak effects and did not confirm direct associations observed in previous studies. Several factors may explain these differences, including variations in study design and sample characteristics.
We acknowledge several limitations in interpreting our study results, such as the cross-sectional nature of the study, potential missing variable bias, and the inability to control for genetic predispositions to mental illness. However, despite these limitations, our study adds important insights to the emerging literature on the differences between rural and urban settings in mental health outcomes.
In conclusion, this study underscores the importance of considering contextual factors in mental health policy and intervention development. By highlighting the differing contextual associations with mental health status between rural and urban areas, we advocate for tailored approaches that acknowledge the unique characteristics of each setting. This recognition is crucial for developing effective strategies to address the mental health needs of diverse populations.
Acknowledgement:
This study was supported, in part, by NIH/AHRQ Training Grant # 2 T32 HS00059 (LP), and VA IIR 06-091 and 1R25T CA111898 (DL).
References
- Almedom A, 2005. Social capital and mental health: an interdisciplinary review of primary evidence. Social Science and Medicine 61, 943–964. [DOI] [PubMed] [Google Scholar]
- Almog M, Curtis S, Copeland A, Congdon P, 2004. Geographical variation in acute psychiatric admissions within New York City 1990–2000: growing inequalities in service use? Social Science and Medicine 59, 361–376. [DOI] [PubMed] [Google Scholar]
- Andersen R, 1995. Revisiting the Behavioral model and access to medical care: does it matter? Journal of Health and Social Behavior 36, 1–10. [PubMed] [Google Scholar]
- Andersen R, Newman J, 1973. Societal and individual determinants of medical care utilization in the United States. Milbank Quarterly 51, 95–124. [PubMed] [Google Scholar]
- Aneshensel CS, Sucoff CA, 1996. The neighborhood context of adolescent mental health. Journal of Health and Social Behavior 37, 293–310. [PubMed] [Google Scholar]
- Bowen DJ, Fesinmeyer MD, Yasui Y, Tworoger S, Ulrich CM, Irwin ML, Rudolph RE, Lacroix KL, Schwartz RR, Mctiernan A, 2006. Randomized trial of exercise in sedentary middle aged women: effects on quality of life. International Journal of Behavioral Nutrition and Physical Activity 3, 34. [DOI] [PMC free article] [PubMed] [Google Scholar]
- Boyle P, Norman P, Rees P, 2004. Changing places. Do changes in the relative deprivation of areas influence limiting long-term illness and mortality among non-migrant people living in non-deprived households? Social Science and Medicine 58, 2459–2471. [DOI] [PubMed] [Google Scholar]
- Christaller W, 1933. The Central Places of Southern Germany. Gustav Fischer, Jena, Germany. [Google Scholar]
- Curtis S, 2007. Socio-economic status and geographies of psychiatric inpatient service use. Places, provision, power and well-being. Epidemiologia e Psichiatria Sociale 16, 10–15. [PubMed] [Google Scholar]
- Curtis S, Copeland A, Fagg J, Congdon P, Almog M, Fitzpatrick J, 2006. The ecological relationship between deprivation, social isolation and rates of hospital admission for acute psychiatric care: a comparison of London and New York City. Health Place 12, 19–37. [DOI] [PubMed] [Google Scholar]
- De Silva MJ, Mckenzie K, Harpham T, Huttly SR, 2005. Social capital and mental illness: a systematic review. Journal of Epidemiology and Community Health 59, 619–627. [DOI] [PMC free article] [PubMed] [Google Scholar]
- Diez Roux AV, 1998. Bringing context back into epidemiology: variables and fallacies in multilevel analysis. American Journal of Public Health 88 (2), 216–222. [DOI] [PMC free article] [PubMed] [Google Scholar]
- Driessen G, Gunther N, Van Os J, 1998. Shared social environment and psychiatric disorder: a multilevel analysis of individual and ecological effects. Social Psychiatry and Psychiatric Epidemiology 33, 606–612. [DOI] [PubMed] [Google Scholar]
- Drukker M, Driessen G, Krabbendam L, Van Os J, 2004. The wider social environment and mental health service use. Acta Psychiatrica Scandinavica 110, 119–129. [DOI] [PubMed] [Google Scholar]
- Economic Research Service (ERS), 2007. U.S. Department of Agriculture. Measuring Rurality: Rural-Urban Continuum Codes. http://www.ers.usda.gov/Briefing/Rurality/RuralUrbCon/S. (accessed 9-1-07). [Google Scholar]
- Ewart CK, Suchday S, 2002. Discovering how urban poverty and violence affect health: development and validation of a Neighborhood Stress Index. Health Psychology 21, 254–262. [DOI] [PubMed] [Google Scholar]
- Harrell FE, 2001. Regression Modeling Strategies: With Applications to Linear Models, Logistic Regression, and Survival Analysis. Springer, New York. [Google Scholar]
- Hendryx MS, Ahern MM, Lovrich NP, Mccurdy AH, 2002. Access to health care and community social capital. Health Services Research 37, 87–103. [PubMed] [Google Scholar]
- Hopman WM, Berger C, Joseph L, Towheed T, Anastassiades T, Tenenhouse A, Poliquin S, Brown JP, Murray TM, Adachi JD, Hanley DA, Papadimitropoulos EA, 2002. Is there regional variation in the SF-36 scores of Canadian adults? Canandian Journal of Public Health 93, 233–237. [DOI] [PMC free article] [PubMed] [Google Scholar]
- Judd F, Murray G, Fraser C, Humphreys J, Hodgins G, Jackson H, 2002. The mental health of rural Australians: developing a framework for strategic research. Australian Journal of Rural Health 10, 296–301. [DOI] [PubMed] [Google Scholar]
- Kawachi I, Kennedy B, 1999. Income Inequality and Health: Pathways and Mechanisms. Health Services Research 34, 215–227. [PMC free article] [PubMed] [Google Scholar]
- Kawachi I, Kennedy B, Wilkinson P, 1999. Crime: social disorganization and relative deprivation. Social Science and Medicine 48, 719–731. [DOI] [PubMed] [Google Scholar]
- Kennedy B, Kawachi I, Prothrow-Stith D, Lochner K, Gupta V, 1998. Social capital, income inequality, and firearm violent crime. Social Science and Medicine 47, 7–17. [DOI] [PubMed] [Google Scholar]
- Kessler RC, Berglund P, Demler O, Jin R, Merikangas KR, Walters EE, 2005. Lifetime prevalence and age-of-onset distributions of DSM-IV disorders in the National Comorbidity Survey Replication. Archives of General Psychiatry 62, 593–602. [DOI] [PubMed] [Google Scholar]
- Kovess-Masfety V, Alonso J, De Graaf R, Demyttenaere K, 2005. A European approach to rural–urban differences in mental health: the ESEMeD 2000 comparative study. Canadian Journal of Psychiatry 50, 926–936. [DOI] [PubMed] [Google Scholar]
- Krieger N, Chen JT, Waterman PD, Soobader MJ, Subramanian SV, Carson R, 2002. Geocoding and monitoring of US socioeconomic inequalities in mortality and cancer incidence: does the choice of area-based measure and geographic level matter? The Public Health Disparities Geocoding Project. American Journal of Epidemiology 156, 471–482. [DOI] [PubMed] [Google Scholar]
- Krieger N, Chen JT, Waterman PD, Soobader MJ, Subramanian SV, Carson R, 2003. Choosing area based socioeconomic measures to monitor social inequalities in low birth weight and childhood lead poisoning: the Public Health Disparities Geocoding Project (US). Journal of Epidemiology and Community Health 57, 186–199. [DOI] [PMC free article] [PubMed] [Google Scholar]
- Lasser K, Boyd JW, Woolhandler S, Himmelstein DU, Mccormick D, Bor DH, 2000. Smoking and mental illness: a population-based prevalence study. JAMA 284, 2606–2610. [DOI] [PubMed] [Google Scholar]
- Lindstrom M, Merlo J, Ostergren PO, 2003. Social capital and sense of insecurity in the neighbourhood: a population-based multilevel analysis in Malmo, Sweden. Social Science and Medicine 56, 1111–1120. [DOI] [PubMed] [Google Scholar]
- Link BG, Phelan J, 1995. Social conditions as fundamental causes of disease. Journal of Health and Social Behavior (Spec No), 80–94. [PubMed] [Google Scholar]
- Litaker D, Cebul RD, 2003. Managed care penetration, insurance status, and access to health care. Medical Care 41, 1086–1095. [DOI] [PubMed] [Google Scholar]
- Litaker D, Love TE, 2005. Health care resource allocation and individuals’ health care needs: examining the degree of fit. Health Policy 73, 183–193. [DOI] [PubMed] [Google Scholar]
- Lorant V, Deliege D, Eaton W, Robert A, Philippot P, Ansseau M, 2003. Socioeconomic inequalities in depression: a meta-analysis. American Journal of Epidemiology 157, 98–112. [DOI] [PubMed] [Google Scholar]
- Macintyre S, Maciver S, Sooman A, 1993. Area, class, and health: should we be focusing on places or people? Journal of Social Policy 22, 213–234. [Google Scholar]
- Mcewen BS, 1998. Protective and damaging effects of stress mediators. The New England Journal of Medicine 338, 171–179. [DOI] [PubMed] [Google Scholar]
- Mitchell C, LaGory M, 2002. Social capital and mental distress in an Impoverished Community. City and Community 1, 199–222. [Google Scholar]
- Muramatsu N, 2003. County-level income inequality and depression among older Americans. Health Services Research 38, 1863–1883. [DOI] [PMC free article] [PubMed] [Google Scholar]
- Neff J, Husaini B, 1987. Urbanicity, Race, and Psychological Distress. Journal of Community Psychology 15, 520–536. [Google Scholar]
- ODH, 1999. Ohio Family Health Survey Methodology Report. Ohio Department of Health (ODH), Colombus, OH. [Google Scholar]
- Pariante CM, Miller AH, 2001. Glucocorticoid receptors in major depression: relevance to pathophysiology and treatment. Biological Psychiatry 49, 391–404. [DOI] [PubMed] [Google Scholar]
- Philo C, Parr H, Burns N, 2003. Rural madness: a geographical reading and critique of the rural mental health literature. Journal of Rural Studies 19, 259–281. [Google Scholar]
- Putnam R, 2000. Bowling Alone: The Collapse and Revival of American Community. Simon & Schuster, New York. [Google Scholar]
- Raudenbush SW, Bryk AS, 2002. Hierarchical Linear Models: Applications and Data Analysis Methods. Sage Publications, Thousand Oaks, CA. [Google Scholar]
- Ricketts T, Johnson-Webb K, Randolph R, 1999. Populations and places in rural America. In: Ricketts TC (Ed.), Rural Health in the United States. Oxford University Press, New York City. [Google Scholar]
- Ross CE, 2000. Neighborhood disadvantage and adult depression. Journal of Health and Social Behavior 41, 177–187, http://www.ingentaconnect.com/content/asoca/jhsbS. [PubMed] [Google Scholar]
- Ross CE, Mirowsky J, 2001. Neighborhood disadvantage, disorder, and health. Journal of Health and Social Behavior 42, 258–276. [PubMed] [Google Scholar]
- Sanderson K, Andrews G, 2002. Prevalence and severity of mental health-related disability and relationship to diagnosis. Psychiatric Services 53, 80–86. [DOI] [PubMed] [Google Scholar]
- Tello JE, Mazzi M, Tansella M, Bonizzato P, Jones J, Amaddeo F, 2005. Does socioeconomic status affect the use of community-based psychiatric services? A South Verona case register study. Acta Psychiatrica Scandinavica 112, 215–223. [DOI] [PubMed] [Google Scholar]
- The World Health Organization, 2004. The World Health Report 2004: changing history, Annex Table 3: burden of disease in DALYs by cause, sex, and mortality stratum in WHO regions, estimates for 2002. Geneva. [Google Scholar]
- Turner R, Lloyd D, 1999. The stress process and the social distribution of depression. Journal of Health and Social Behavior 40, 374–404. [PubMed] [Google Scholar]
- Wainwright NW, Surtees PG, 2004. Places, people, and their physical and mental functional health. Journal of Epidemiology and Community Health 58, 333–339. [DOI] [PMC free article] [PubMed] [Google Scholar]
- Ware J Jr., Kosinski M, Keller SD, 1996. A 12-Item short-form health survey: construction of scales and preliminary tests of reliability and validity. Medical Care 34, 220–233. [DOI] [PubMed] [Google Scholar]
- Ware J Jr., Kosinski M, Turner-Bowker D, Gandek B, 2002. How to Score Version 2 of the SF-12 Health Survey (With a Supplement Documenting Version 1). QualityMetric Incorportated, Lincoln, RI. [Google Scholar]
- Weeks W, Kazis L, Shen Y, Cong Z, Ren X, Miller D, Lee A, Perlin J, 2004. Differences in health-related quality of life in rural and urban veterans. American Journal of Public Health 94, 1762–1767. [DOI] [PMC free article] [PubMed] [Google Scholar]
- Weich S, Lewis G, 1998. Poverty, unemployment, and common mental disorders: population based cohort study. BMJ 317, 115–119. [DOI] [PMC free article] [PubMed] [Google Scholar]
- Weich S, Lewis G, Jenkins S, 2001a. Income inequality and the prevalence of common mental disorders in Britain. British Journal of Psychiatry 178, 222–227. [DOI] [PubMed] [Google Scholar]
- Weich S, Sloggett A, Lewis G, 2001b. Social roles and the gender difference in rates of the common mental disorders in Britain: a 7-year, population-based cohort study. Psychological Medicine 31, 1055–1064. [DOI] [PubMed] [Google Scholar]
- Weich S, Twigg L, Holt G, Lewis G, Jones K, 2003. Contextual risk factors for the common mental disorders in Britain: a multilevel investigation of the effects of place. Journal of Epidemiology and Community Health 57, 616–621. [DOI] [PMC free article] [PubMed] [Google Scholar]
- Weich S, Nazroo J, Sproston K, Mcmanus S, Blanchard M, Erens B, Karlsen S, King M, Lloyd K, Stansfeld S, Tyrer P, 2004. Common mental disorders and ethnicity in England: the EMPIRIC study. Psycholgical Medicine 34, 1543–1551. [DOI] [PubMed] [Google Scholar]
- Yen I, Kaplan G, 1999. Poverty area residence and changes in depression and perceived health status: evidence from the Alameda county study. International Journal of Epidemiology 28, 90–94. [DOI] [PubMed] [Google Scholar]