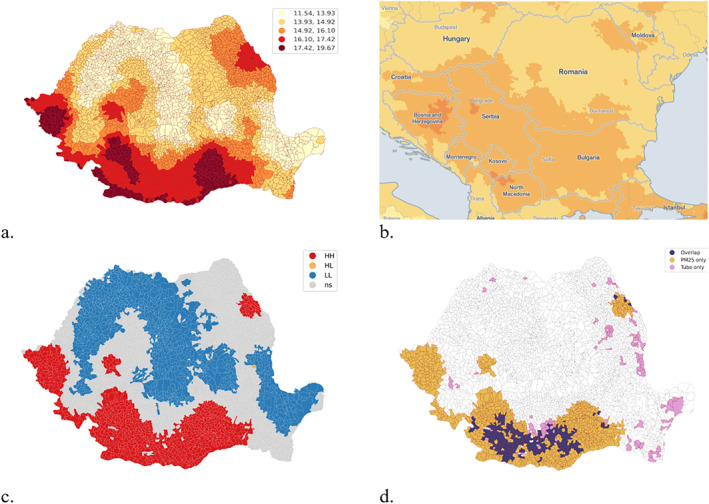
Figure 12.

(a) Geographical distribution of annual average values of particulate matter (PM2.5) in Romania between 2015 and 2021. Local spatial autocorrelation of PM2.5. (b) Balkan context of PM2.5. Source: https://aqli.epic.uchicago.edu/the-index/. (c) PM2.5 Local Spatial Clusters. (d) Overlap between tuberculosis and PM2.5 local clusters.
